

Hallo zusammen!
Happy New Year to everyone.
I haven’t written since December 5th. Several personal reasons kept me from reviewing the market in depth, but there is another, perhaps more significant reason for my silence: I haven’t seen any important changes in the market structure, at least for BTC and ETH, that motivated me to write.
More of the Same: The Consolidation Trap
What I have seen over the last month is simply “more of the same.” We see movements that appear to have a clear intention, only to be nullified shortly after. This confirms that the situation hasn’t changed. Retail traders see what look like signals, enter with high leverage, and are subsequently slaughtered by the counter-move.
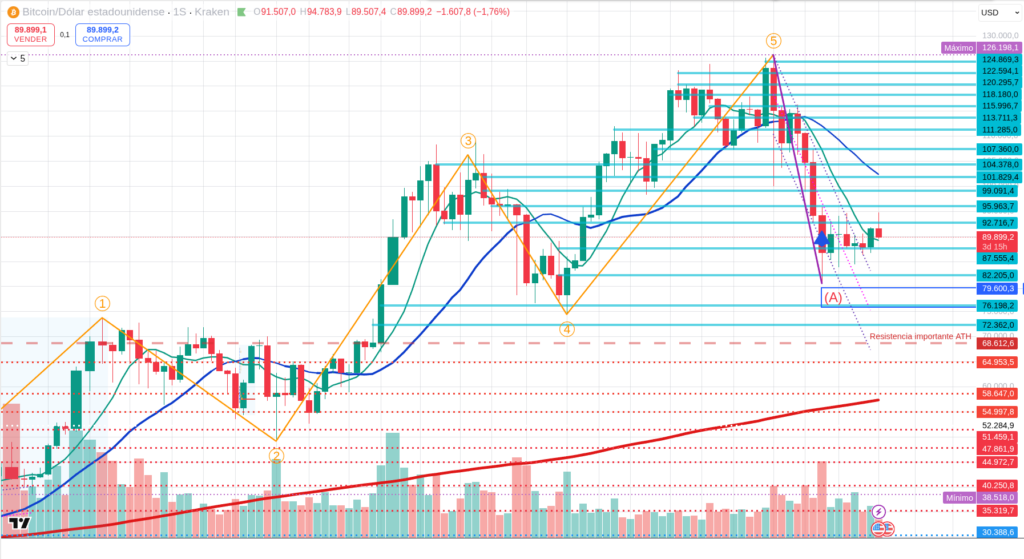
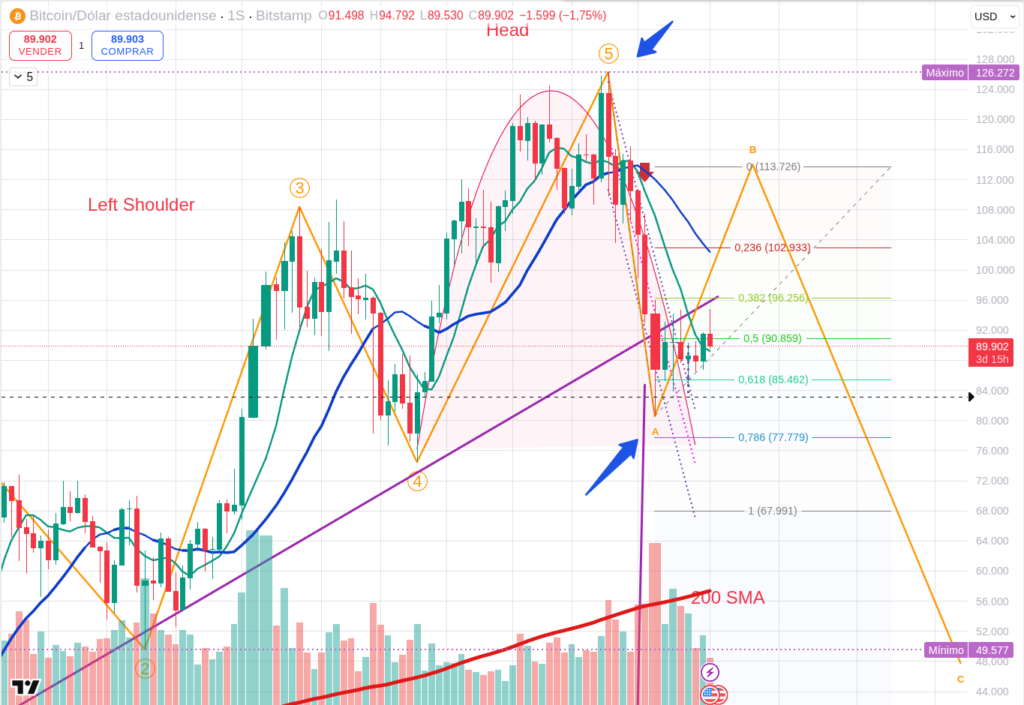
However, one thing is clear on the charts: BTC and ETH have entered a consolidation phase (or a pause) on both the daily and weekly timeframes. This pause can break in any direction, determined ultimately by supply and demand.
Revisiting the “Wave B” Theory
My theory formulated on December 5th (which you can read here: [The Lone Trader’s Watch: A Theory on Bitcoin’s Weekly Chart – Is Wave B Beginning?] remains unchanged. If you read that post, you will notice that the price today is practically the same as it was then.
In the case of Bitcoin, it is possible that we have initiated the corrective Wave B based on the weekly chart. But remember, this is just a theory based on Elliott Waves.
The Danger of the ABC Correction As many of you know, there are many types of ABC corrections. Some have a very small B wave, others are longer, some are flat/lateral. The issue is that these corrections are dangerous because they are designed to deceive. They often fool novice traders into thinking the movement is a new impulse with the strength to surpass the previous High, just before—abruptly—the path towards Wave C begins and the trap shuts.
As the saying goes: “The trend is your friend, until it ends.”
Current Market Snapshot
Prices at the time of writing this post:
-
BTC (~$90,000) & ETH (~$3,100): Both are in that dangerous consolidation zone.
-
BNB (~$881): In the same situation as the leaders.
-
SOL (~$134): This is the one that looks the most dangerous to me. I see it indisputably falling to around $77. I don’t know when, but the structure does not look good. Of all the assets analyzed, SOL is the one I refuse to touch. It requires nerves of steel and algorithms to trade it right now.
Be patient. In a consolidation, doing nothing is often the best trade.
Disclaimer: This content is for informational purposes only and represents personal observations and technical analysis. It does not constitute financial, investment, or trading advice. Please conduct your own research and consult a professional before making any financial decisions. For our full statement, please read our disclaimer here: https://tavoplus.com/disclaimer/