Hallo zusammen!
It’s funny how a bullish trap works.
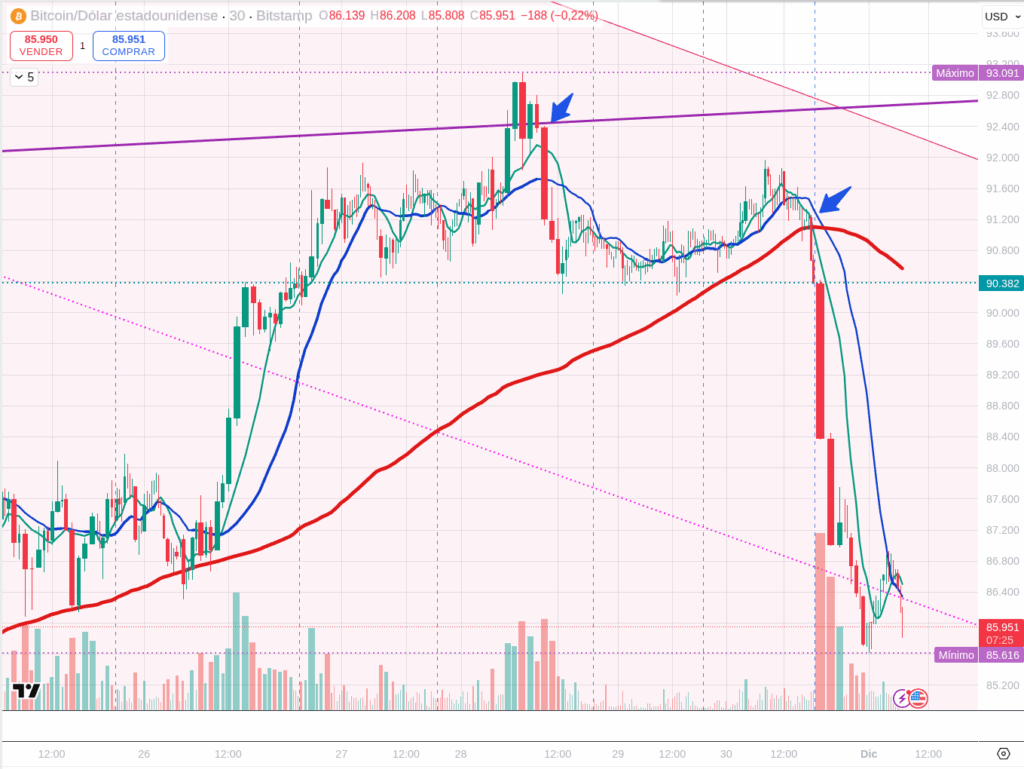
On Friday, during the half-day session and options expiry, BTC faced a critical crossroads at its long-term trendline. As I mentioned, this line had been broken days earlier, but a potential reversal signal—an inverted hammer on Sunday the 23rd, confirmed on Monday the 24th—gave some hope.
Price timidly recovered, but on Friday, it hit the underside of that new resistance formed by the daily trendline. Everything looked fine until the close, when supply overwhelmed demand, and the price fell convincingly.
Despite everything, the week closed in the green. But right after the monthly close, the trap sprung. Price plunged from $91,200 down to $85,600 in just a few hours during the Asian opening.
The ABC Theory vs. “Hopium”
My theory, which I’ve explained several times, is that the price will seek levels around $50,000, or the weekly 200 SMA, likely forming an ABC correction.
- Wave A: The initial drop.
- Wave B: A relief rally that recovers some price but inevitably fails.
- Wave C: The final leg down to complete the correction.
We can’t know for sure what shape this ABC will take. I’ve read people cheering for a $250,000 year-end target. I don’t see that as possible. It’s just gasoline for novice buyers thinking they’ll double their savings quickly. The truth is, this is not the time to buy. You know it when the red bars are much more forceful than the green ones.
We’ll see how today behaves, but I fear we are going deeper.
The Macro Picture: Manufacturing PMI
Today, Monday, December 1, 2025, the main economic event is the US ISM Manufacturing PMI at 10:00 AM ET (16:00 CET). A weaker-than-expected number could boost rate cut bets, potentially offering some support to risk assets. We will also hear from several FED members throughout the day.
Technical Snapshot: The Damage Done (30-Min Charts)
The weekend drop has done significant technical damage, pushing prices well below key support levels.
(Current reference prices: BTC ~$85,900, ETH ~$2,820, SOL ~$126, BNB ~$821. Remember, these are observations, not predictions.)
- BTC (Bitcoin): Trading around $85,900, BTC has shattered support. Immediate resistance is now the previous support level around $88,000 – $90,000. The next major support zone down is $80,000 – $82,000.
- ETH (Ethereum): At $2,820, ETH is deep in corrective territory. It needs to reclaim $3,000 to show any sign of life. Immediate support is at the recent lows around $2,800.
- SOL (Solana): Trading near $126, SOL is showing high beta weakness. Immediate resistance is at $140. Support is around $120 – $125.
- BNB (BNB): At $821, BNB has also succumbed to the selling pressure. Resistance is at $880 – $900, with support around $800.
Final Thoughts
The Friday bull trap was textbook, followed by a brutal weekend flush. The red bars are telling the story right now. While a relief bounce (Wave B) is possible at some point, the trend is clearly down, and catching a falling knife is not the strategy. Stay safe.
Disclaimer: This content is for informational purposes only and represents personal observations and technical analysis. It does not constitute financial, investment, or trading advice. Please conduct your own research and consult a professional before making any financial decisions. For our full statement, please read our disclaimer here: https://tavoplus.com/disclaimer/