


Hallo zusammen!
Yesterday was a testament to the market’s unpredictability. Ethereum (ETH) saw a sharp 5% drop post-FED, only to recover to a -2.5% close. Bitcoin (BTC) ended the day down -1.63%. These are not minor corrections, especially after Powell’s mixed signals.
Right now, ETH is trying to find its footing, testing if it can hold above $3,810, still quite a distance from its daily SMA200. Bitcoin, at $107,300, is right there at its daily SMA200.
Recognizing when a downtrend truly begins is never easy, especially when you’re looking at charts with a natural bias. But if these critical levels break today, I’d dare to think that a more significant correction might have just initiated. Both BTC and ETH have printed four consecutive candles in the previous days, each with higher volume than the green candles that led into this pullback. That’s a classic bearish signal, suggesting distribution rather than accumulation.
Today, it’s absolutely crucial to observe how prices behave at these pivotal levels.
The Macro Picture: Double Trouble – Eurozone & U.S. Inflation Ahead
Today, October 31, 2025, is far from a quiet day. We have significant catalysts that can, and likely will, move the markets across the board.
- Europe (European Morning): Flash CPI (Eurozone Preliminary Inflation, October)
- This is the quick estimate of Eurozone inflation. It’s key because the European Central Bank (ECB) held rates steady yesterday at 2%, stating policy is “in a good place.”
- Lower than expected inflation: Could lead to a European market rally (relief for future financial costs), which often spills over into global risk appetite, including the Nasdaq.
- Higher than expected inflation: Reignites fears that the ECB might need to harden its tone again, pressuring European banks and cyclical stocks, and potentially dragging down the U.S. tech sector (Nasdaq) due to expectations of “higher for longer” global rates.
- Also, keep an eye on Eurozone Growth/Activity data. Recent positive surprises in services and new orders (PMI) have supported a “soft landing” narrative. If this holds, it helps set a constructive tone for the U.S. market open.
- United States (European Afternoon / NYC Session):
- PCE / Core PCE (U.S. Consumer Inflation): This is the big one. Today, we get the September PCE indicator (including the “core” index, excluding food and energy). This is the Federal Reserve’s favorite thermometer for measuring underlying inflation. It’s scheduled for release today.
- Lower than expected PCE: Reinforces the idea that “the Fed can continue to ease without sudden urgency,” typically boosting growth/tech stocks on the Nasdaq and, by extension, risk assets like Bitcoin.
- Hotter PCE: Reignites the concern that the Fed might cut rates slower than the market desires. This would sap momentum from mega-cap tech and usually hits crypto hard, as it signals less future liquidity.
- Chicago PMI (U.S. Regional Manufacturing Activity): This October data (9:45 AM NY time) is a precursor to the national ISM Manufacturing report.
- Very weak PMI: Confirms industrial slowdown, pressing Dow and industrial sectors. Paradoxically, this can support the “Fed will have to stay soft” narrative, benefiting Nasdaq/high-growth.
- Unexpectedly strong PMI: Could shift flows towards value/industrials, potentially dimming the pure tech trade.
- PCE / Core PCE (U.S. Consumer Inflation): This is the big one. Today, we get the September PCE indicator (including the “core” index, excluding food and energy). This is the Federal Reserve’s favorite thermometer for measuring underlying inflation. It’s scheduled for release today.
- Mega-Cap Corporate Earnings (Apple’s Impact):
- Apple published quarterly results last night, showing revenue growth, strength in iPhone 17 and services, and provided strong guidance for the December fiscal quarter. This was interpreted as “revenue story still alive,” pushing the stock up in after-hours trading and boosting its market cap above $4 trillion.
- Relevance: Apple heavily influences the Nasdaq 100 and S&P 500. A sustained upward gap in Apple often spills over to the entire mega-tech complex, potentially starting the Nasdaq session in the green, even if macro data is mixed.
My Conclusion on the Agenda: Today is a heavily data-sensitive day. We have Eurozone inflation, U.S. PCE (the Fed’s key metric), Chicago PMI, and the ripple effects of Apple’s strong earnings. All these are crucial for NYSE, Nasdaq, and, by extension, the crypto market, which at these valuations, is trading more like a risk/macro-liquidity asset than a safe haven.
The Lone Trader’s Lens: Action Price & Risk Management (30-Min Charts)
My trading philosophy, “Action Price,” focuses on observing where real money and aggression enter the market—where prices strongly bounce or are rejected, liquidity sweeps of recent highs/lows, and the relationship between the current price and those levels.
(Current reference prices: BTC ~$109,900, ETH ~$3,845, SOL ~$186.61. Remember, these are observations, not predictions or recommendations.)
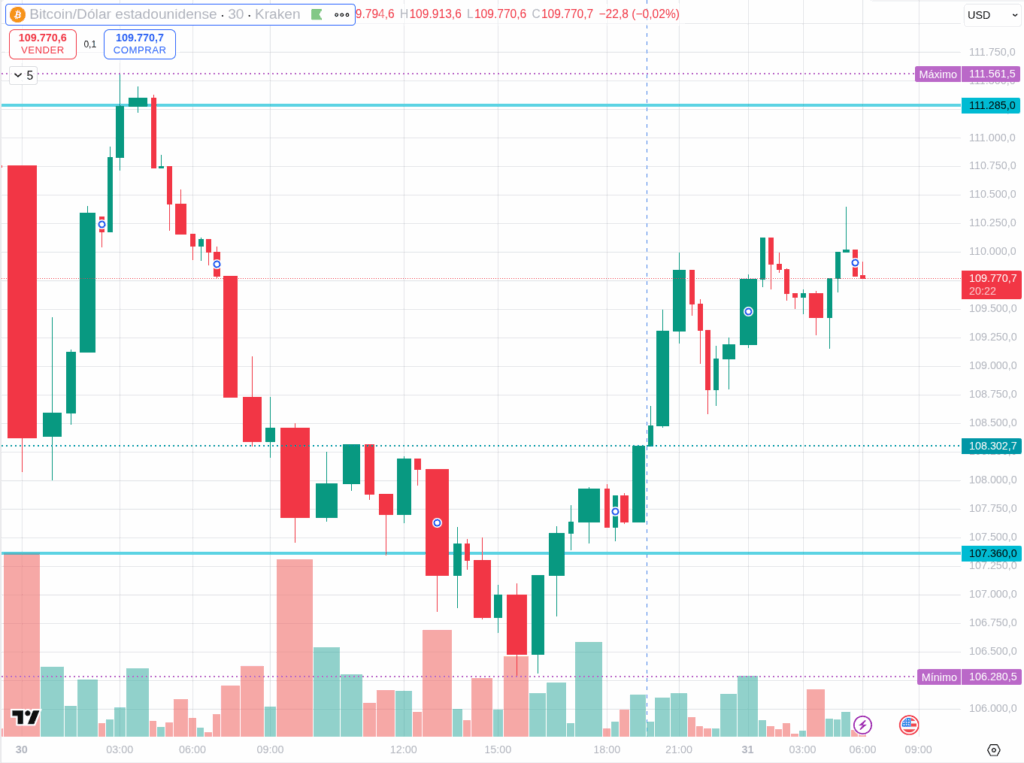
BTCUSDT (30 min)
Bitcoin, currently at $109,900, is flirting with a critical level (SMA200 daily) after yesterday’s pullback.
- Immediate Resistance: ~$111,000 – $111,500
- Pivot / Control Zone: ~$109,500 – $110,500 (Around its daily SMA200)
- Key Support: ~$106,500 – $107,000
What to Watch: * Holding the $109,500-$110,500 zone (and especially the daily SMA200) is paramount today. A strong bounce here would indicate that buyers are defending this crucial level. * If BTC breaks below $106,500 with conviction, that would be a very strong signal that the correction I’m anticipating might be fully underway. * Conversely, a strong close above $111,500 would suggest the selling pressure from yesterday has been absorbed.
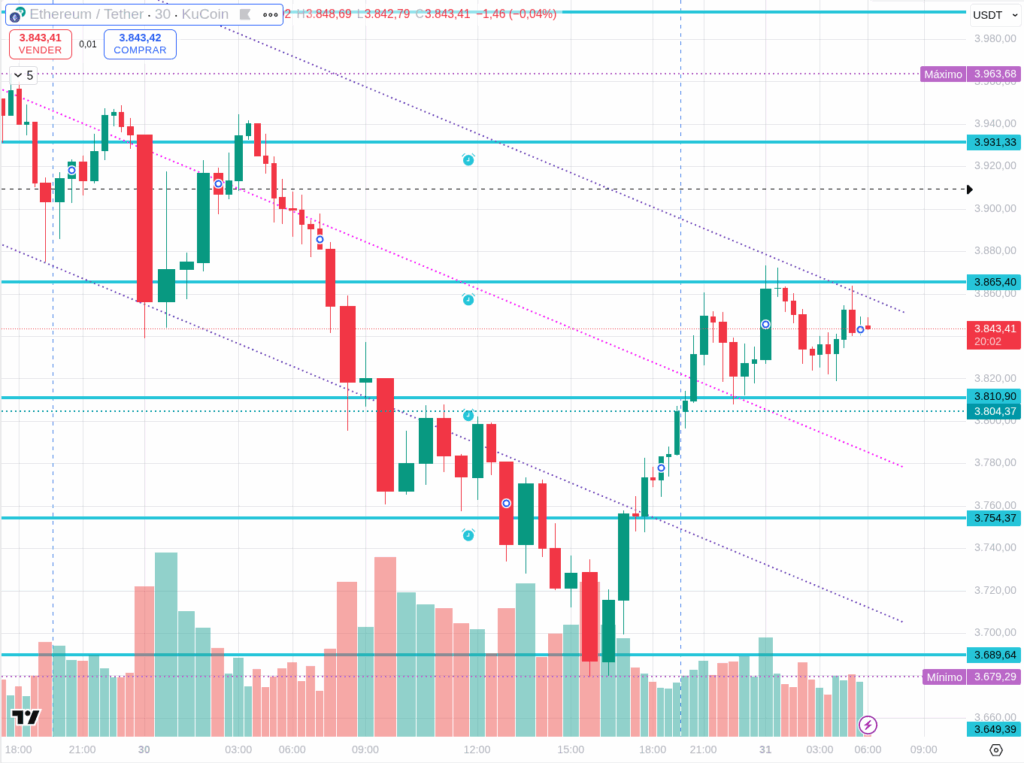
ETHUSDT (30 min)
Ethereum, at $3,845, is testing if it can stay above $3,810, still far from its daily SMA200, which suggests deeper weakness than BTC.
- Immediate Resistance: ~$3,900 – $3,950
- Pivot / Control Zone: ~$3,800 – $3,850 (Testing the $3,810 level)
- Key Support: ~$3,700 – $3,720
What to Watch: * ETH needs to defend the $3,800-$3,850 zone. If it fails here, it significantly increases the probability of a deeper correction. * Its distance from the daily SMA200 (compared to BTC) implies it’s already in a weaker technical position. * A break below $3,700 would invalidate any recovery attempts and signal further downside.
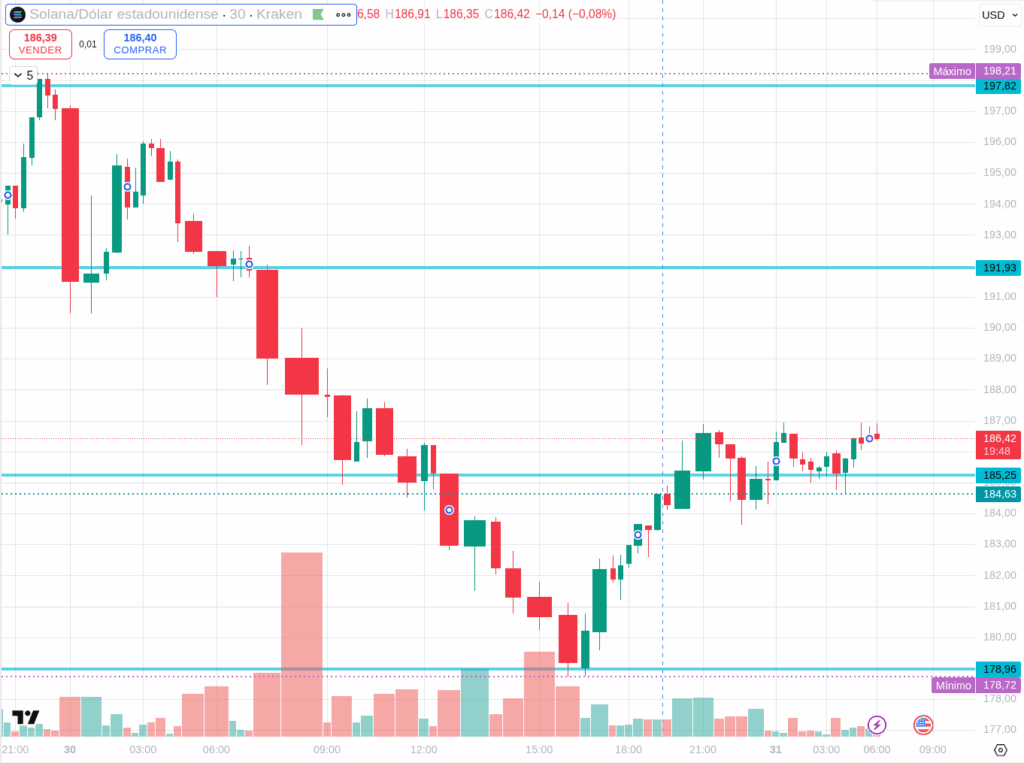
SOLUSDT (30 min)
Solana, at $186.61, showed less of a dramatic pullback yesterday, but is still trading in a volatile range.
- Immediate Resistance: ~$190 – $193
- Pivot / Control Zone: ~$185 – $188
- Key Support: ~$178 – $180
What to Watch: * SOL’s resilience yesterday (only -0.09%) is notable. However, it still needs to reclaim $190 to show sustained strength. * A break below $185 would put the $178-$180 support zone in play. * This is a high-beta asset; if the macro signals turn heavily “risk-off,” SOL could be the first to experience sharper liquidations.
Final Thoughts: The Correction Question
Today is crucial. With the CPI Flash from the Eurozone and the U.S. PCE data on deck, along with Apple’s after-hours boost to Nasdaq, the market has ample catalysts. My focus is intently on how BTC and ETH react to their respective SMA200 (BTC) and key support levels (ETH).
The pattern of four higher-volume bearish candles is a serious warning. If these levels break today, it might indeed mark the start of a more pronounced correction. As a lone trader, my job isn’t to predict, but to react to what the charts and macro events tell me. Today, they’re screaming “caution.”
Disclaimer: This content is for informational purposes only and represents personal observations and technical analysis. It does not constitute financial, investment, or trading advice. Please conduct your own research and consult a professional before making any financial decisions. For our full statement, please read our disclaimer here: https://tavoplus.com/disclaimer/