


Hallo zusammen!
Happy Monday. As we start a new week, I want to share a core premise that guides my view of the markets, especially in times like these.
Markets often move in unexpected ways, which is why I must clarify that I’m not attempting to predict anything; I am simply observing what I see. My core philosophy on price action is this: If a price is moving in a direction contrary to what everyone else is preaching, what makes you think the situation will magically change?
Miracles don’t happen in the markets. Why? Because capital is cowardly. If a group of professional traders with significant capital is moving in one direction, I try to follow that current, not fight against it.
I mention this because, looking at the charts, it certainly seems that Bitcoin (BTC), Ethereum (ETH), and Solana (SOL) are beginning to enter a downtrend, or at least a significant correction.
We are seeing clear zones in these assets where large sell orders exist, which inevitably pushes the price in the opposite direction. This is then exacerbated by the stop-losses of leveraged traders, which act like gasoline on a fire, intensifying the downward movement.
Where Might the Current Be Taking Us?
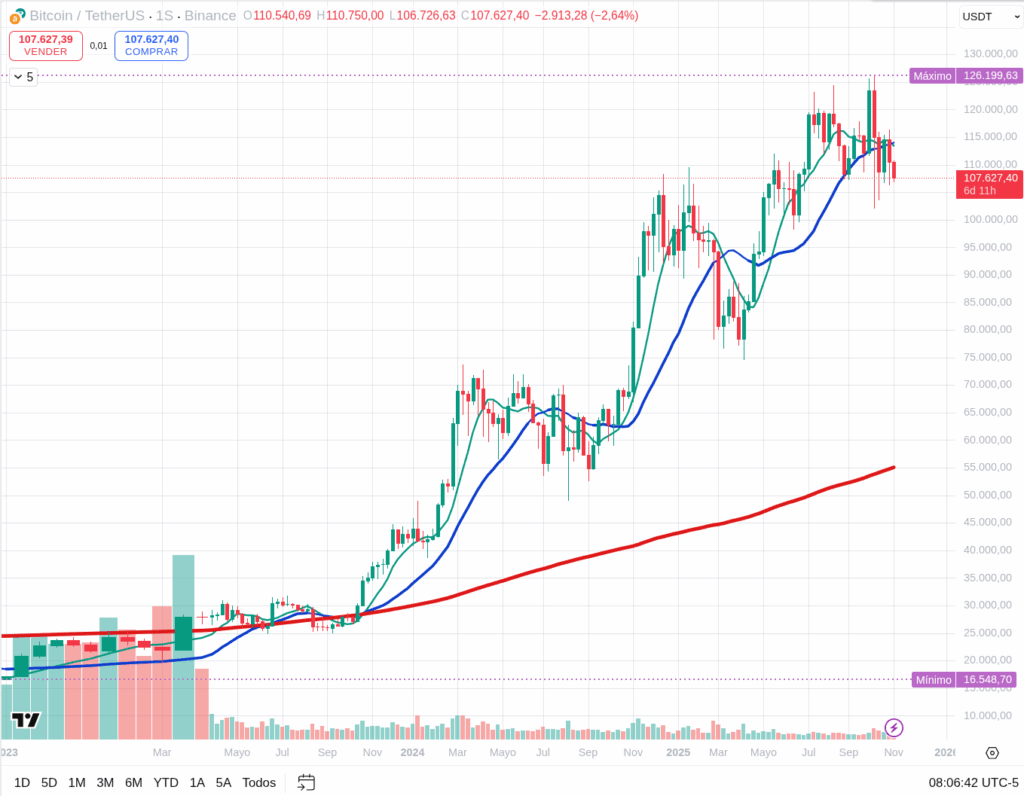
When I zoom out and look at the larger timeframes, I see potential long-term targets that often act as gravitational zones for price.
- For ETH, the 200-week SMA (Simple Moving Average), a massive historical support level, is currently sitting around $2,440.
- For BTC, a similar deep support zone lies around $55,000.
- For SOL, a logical retracement area is around $100.
To be perfectly clear: we cannot predict with any certainty that these prices will be hit, or when. But the probability exists, especially knowing how these assets move when a true correction takes hold. These are just zones, and the price often extends beyond them.
We’ll see what happens this week. I believe by the end of it, we might have more clarity… or perhaps not. Only time will tell.

The Macro Landscape: A “Waiting Game” Day
Today, Monday, November 3, 2025, the macro calendar is relatively light, which often means technicals and market flow dominate.
The main event to watch for today is the ISM Services PMI at 10:00 AM ET (NYC Time). This data gives us a snapshot of the health of the U.S. services sector (the main engine of the economy).
- A stronger-than-expected number could reinforce the “higher for longer” narrative for the FED, which is generally bad for risk assets like crypto and the Nasdaq.
- A weaker-than-expected number might give the market hope for faster FED easing, which could provide a temporary boost.
Since this isn’t a “main event” like the FED rate decision or CPI, the market is likely in a “wait-and-see” mode, dominated by technical flows rather than a fundamental shock.
Technical Analysis: The Downtrend Takes Shape (30-Min Charts)
Instead of a repetitive breakdown, let’s look at the assets through the lens of this potential downtrend.
(Current reference prices: BTC ~$107,900, ETH ~$3,717, SOL ~$176. Remember, these are observations, not predictions or recommendations.)
All three assets—BTC, ETH, and SOL—are showing similar technical weakness on the 30-minute charts.
- Price Structure: They are all trading below their key short-term moving averages (like the 20 and 50-period), which confirms the short-term trend is negative.
- Momentum (RSI/MACD): The RSI on all three is hovering in weak territory (below 50, near 40 or even lower for SOL), indicating that bullish momentum has faded. The MACD on these timeframes has likely seen a “death cross” (short-term average crossing below the long-term) and is struggling in negative territory.
The Key Levels I’m Watching Today:
Based on the current prices, the market is sitting on a precarious ledge.
- BTC ($107,900): The immediate battle is to stay above the $107,000 – $108,000 support zone. If that breaks, the path to $105,500 opens up quickly. Resistance now sits firmly at $110,000.
- ETH ($3,717): This is a critical level. The support zone I’m watching is $3,700 – $3,720. A break below this with volume would be a very bearish confirmation, likely accelerating the move towards its deeper target if the downtrend gains traction. Resistance is now at $3,800 – $3,850.
- SOL ($176): As the most volatile, SOL is showing the most weakness (RSI likely near oversold). The key support is $170 – $175. If that fails, the drop could be fast. Resistance is now $180 – $185.
Final Thoughts: Don’t Fight the Tape
Today, the market is giving us clear signals of technical weakness. The macro calendar is quiet, meaning we are left with pure price action. My approach remains simple: I’m not fighting this. I am observing to see if these key support levels hold or if the current (the downtrend) gains strength.
Disclaimer: This content is for informational purposes only and represents personal observations and technical analysis. It does not constitute financial, investment, or trading advice. Please conduct your own research and consult a professional before making any financial decisions. For our full statement, please read our disclaimer here: https://tavoplus.com/disclaimer/