


Hallo zusammen!
As I look at the charts this Wednesday, I don’t see a much clearer picture than yesterday. The European market is currently trying to erase yesterday’s negative moves (BTC -2.80%, ETH -4.22%, SOL -7.60%, BNB -3.68%), but it’s still early for the American open. We must remember that yesterday, too, started very positive (+1% or even +2% for ETH) only to deflate as soon as the U.S. market opened.
This brings up the topic of volatility in digital assets. In this market, a 5% move in either direction (or much more) is completely natural. This isn’t just organic trading; it’s fueled by a massive amount of over-leveraged traders and, crucially, algorithmic trading.
A quick note on Algorithmic (Algo) Trading: In simple terms, these are high-speed, automated computer programs designed to trade based on pre-defined rules, technical signals, or news. They operate at speeds no human can possibly match. They scan for liquidity, trigger stop-losses, and execute millions of orders in fractions of a second. This is why, as retail traders, aspiring to “beat the machines” in their own game (like high-frequency scalping) is often a losing proposition.
Tomorrow, we get the November CPI (inflation) data, which means we are guaranteed another day of extreme volatility.
My Technical Observations
I’m keeping a close eye on the daily charts. Yesterday, I made a mistake in my post when I said the 200 SMA was negative—that’s incorrect. It’s the 20 and 50 SMAs that are clearly pointing downwards, which is a classic sign of a short-to-medium-term downtrend.
- ETH ($3,545): Is currently trying to hold onto its daily SMA 200 for dear life. This is a critical battleground.
- BTC ($104,874) & SOL ($159.85): Both are already trading below their daily SMA 200, which is a sign of significant weakness.
- BNB ($970.56): Remains the outlier, trading far above its 200 SMA, showing much more relative strength than SOL or ETH.
Today is a day of transition and anticipation. We will be watching what happens, especially tomorrow.
The Macro Picture: A Deep Breath Before the CPI
Today, Wednesday, November 12, 2025, is clearly a “transition day” before the main event: tomorrow’s U.S. CPI report.
- Europe (Morning): We saw the release of Eurozone Industrial Production data. A better-than-expected number supports the “soft landing” narrative, which is generally good for risk appetite. We also have ongoing ECB speeches (Lagarde, etc.), which can always move the Euro and market sentiment.
- United States (NY Session): Today’s calendar is light on “market-breaking” data. We have the NFIB Small Business Optimism Index and more FED speeches (like Williams from NY).
- These are second-tier indicators, but in a market hungry for clues, any “hawkish” (inflation-fighting) or “dovish” (pro-growth) comments can cause ripples.
My Conclusion on the Agenda: With no major, explosive data due today, the market will be driven by technical flows and, more importantly, positioning ahead of tomorrow’s CPI. This is the “calm before the storm.”
Technical Analysis: The Intraday Rebound (30-Min Charts)
After the recent drops, all four of our assets are showing a technical rebound from their intraday lows, currently trading in the upper half of their daily range.
(Current reference prices: BTC ~$104,874, ETH ~$3,545, SOL ~$159.85, BNB ~$970.56. Remember, these are observations, not predictions or recommendations.)
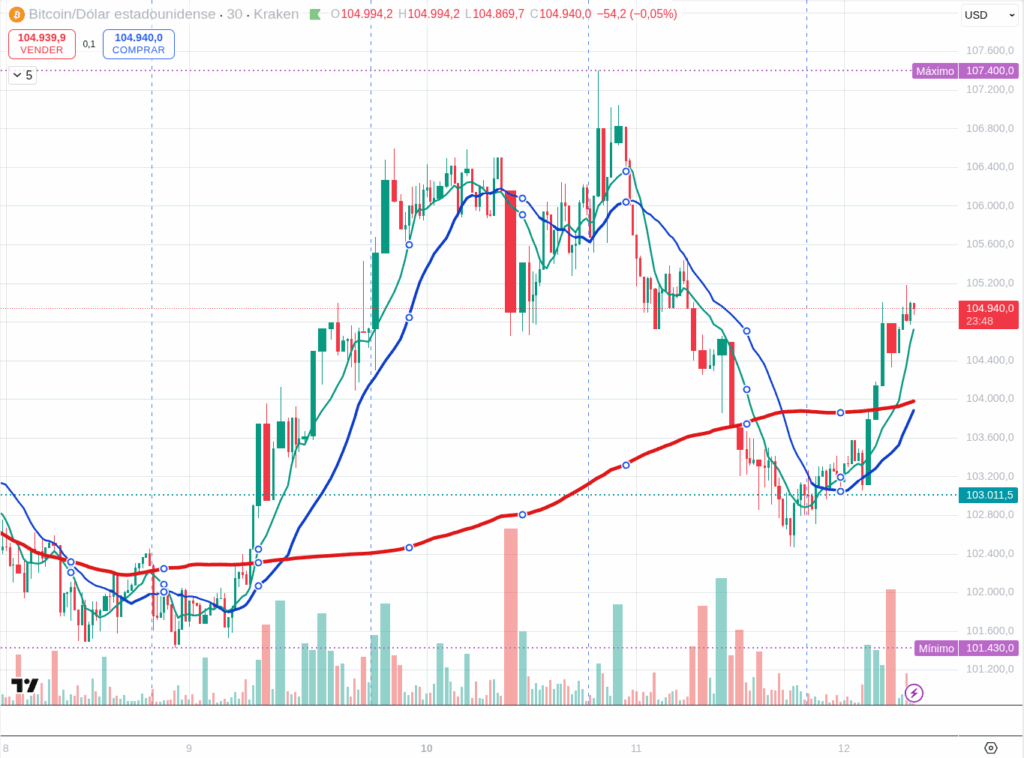
BTCUSDT (30 min)
BTC is rebounding from the $102,460 low, now testing the $105,465 resistance.
- Immediate Resistance: ~$105,500 – $106,000
- Pivot / Control Zone: ~$104,500 – $105,000
- Key Support: ~$102,500 – $103,000
What to Watch: * The rebound is constructive, with the RSI (30m) likely moving into the 50-60 zone (moderate positive momentum) and the MACD (30m) attempting a bullish cross. * The key is whether BTC can break and hold above $105,500. A failure here would just be a bounce in a downtrend.
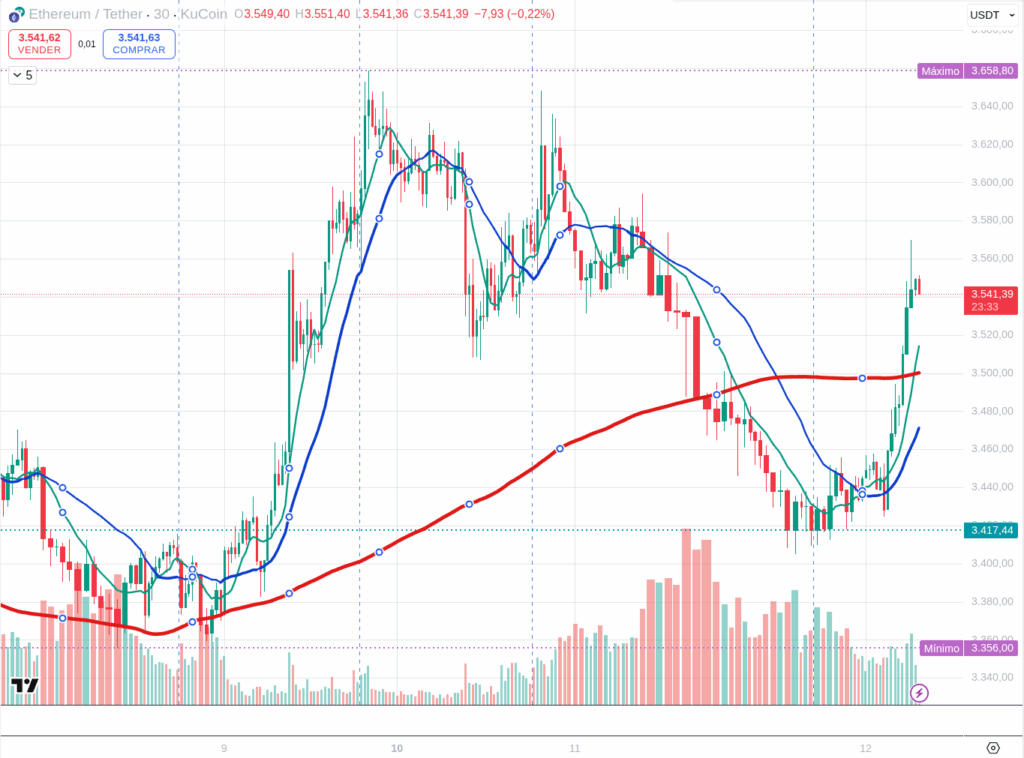
ETHUSDT (30 min)
ETH, rebounding from $3,405, looks slightly stronger than BTC in this immediate bounce.
- Immediate Resistance: ~$3,580 – $3,600
- Pivot / Control Zone: ~$3,500 – $3,550
- Key Support: ~$3,400 – $3,430
What to Watch: * ETH is holding the upper end of its range well. The RSI (30m) is likely in the 55-65 zone (stronger relative strength) and the MACD (30m) probably shows a clean bullish cross. * This looks like the most “ready” of the majors for a continued short-term rally, if the market allows it. A break above $3,600 would be significant.
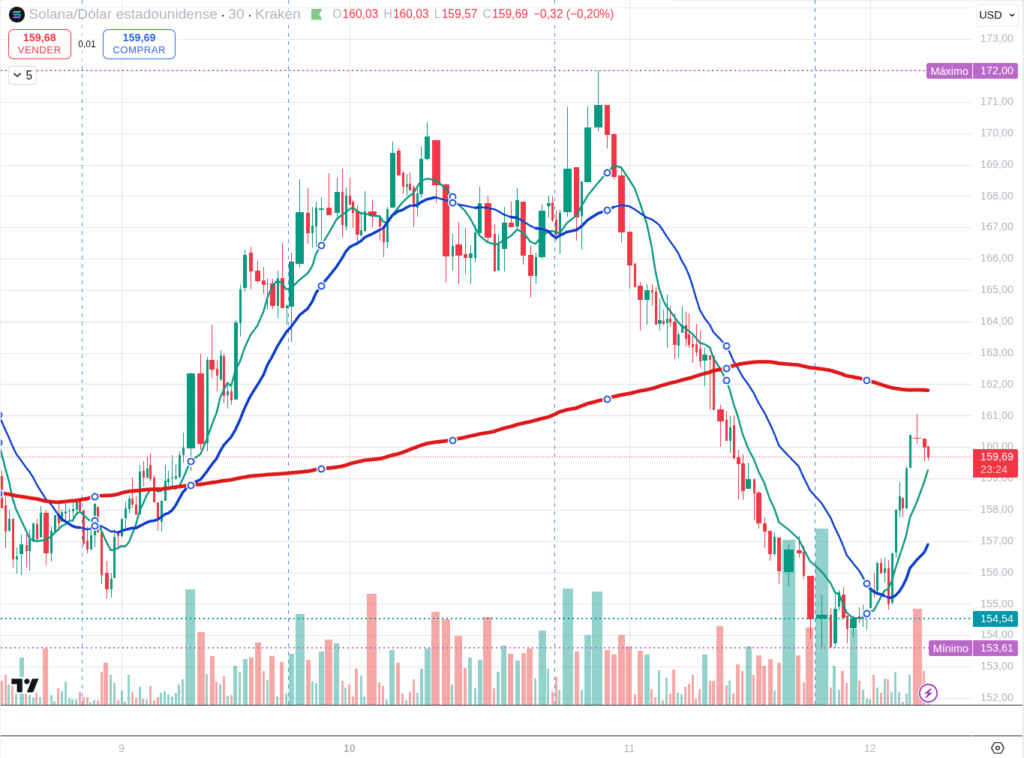
SOLUSDT (30 min)
SOL, the high-beta asset, bounced from $153.80 and is now around $160.
- Immediate Resistance: ~$163 – $165
- Pivot / Control Zone: ~$158 – $161
- Key Support: ~$154 – $156
What to Watch: * SOL’s moves are always sharper. The RSI (30m) likely came out of deep oversold territory and is now neutral-positive (50-60). * The MACD (30m) is likely turning positive but might be lagging ETH. A break above $165 could trigger a fast, algo-driven move higher.
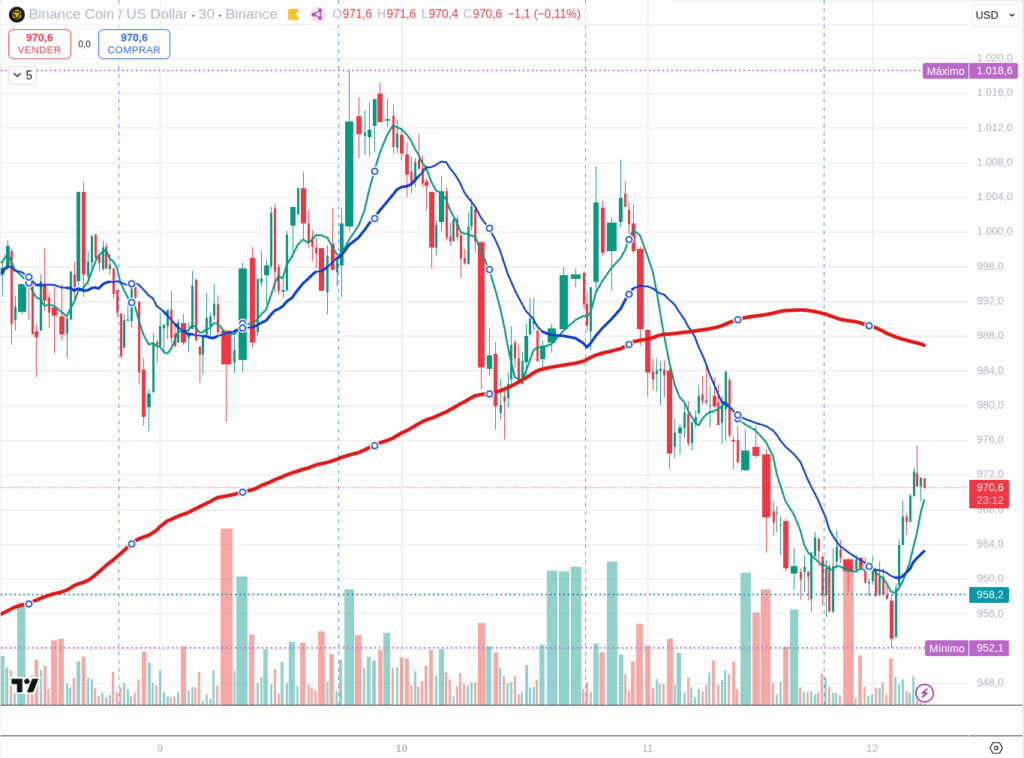
BNBUSDT (30 min)
BNB, the “blue chip,” bounced cleanly from $952 and is now strong at $970.
- Immediate Resistance: ~$980 – $985
- Pivot / Control Zone: ~$960 – $970
- Key Support: ~$952 – $960
What to Watch: * BNB looks very constructive, similar to ETH. It’s holding its pivot zone as support. * The RSI (30m) is likely in the healthy 50-60 range, and the MACD (30m) is probably showing a clean bullish turn. * If it can hold above $970, a test of $985 and the $1,000 level is the natural short-term objective.
Final Thoughts: Tomorrow is the Real Test
Today is a day of technical recovery and posturing. ETH and BNB look the cleanest on the short-term rebound. BTC and SOL are still working to prove themselves.
However, all of this is just the opening act. Tomorrow’s CPI report is the main event. This entire rebound could be erased—or dramatically accelerated—in a matter of minutes. As always, be mindful of the algorithmic volatility and don’t try to outsmart the machines. Let’s see how these levels hold after the American open.
Disclaimer: This content is for informational purposes only and represents personal observations and technical analysis. It does not constitute financial, investment, or trading advice. Please conduct your own research and consult a professional before making any financial decisions. For our full statement, please read our disclaimer here: https://tavoplus.com/disclaimer/