Hallo zusammen!
It’s Friday, December 5, 2025. Today, I want to step away from the intraday noise and share an opinion piece regarding the Bitcoin (BTC) weekly chart.
I want to be crystal clear: What I am writing today is a theory based on Elliott Wave principles and Price Action. It does not mean it is the absolute reality, nor should you make financial decisions based solely on this post. Take it for what it is: just one opinion among thousands in the market.
The Fractal Nature of the Impulse
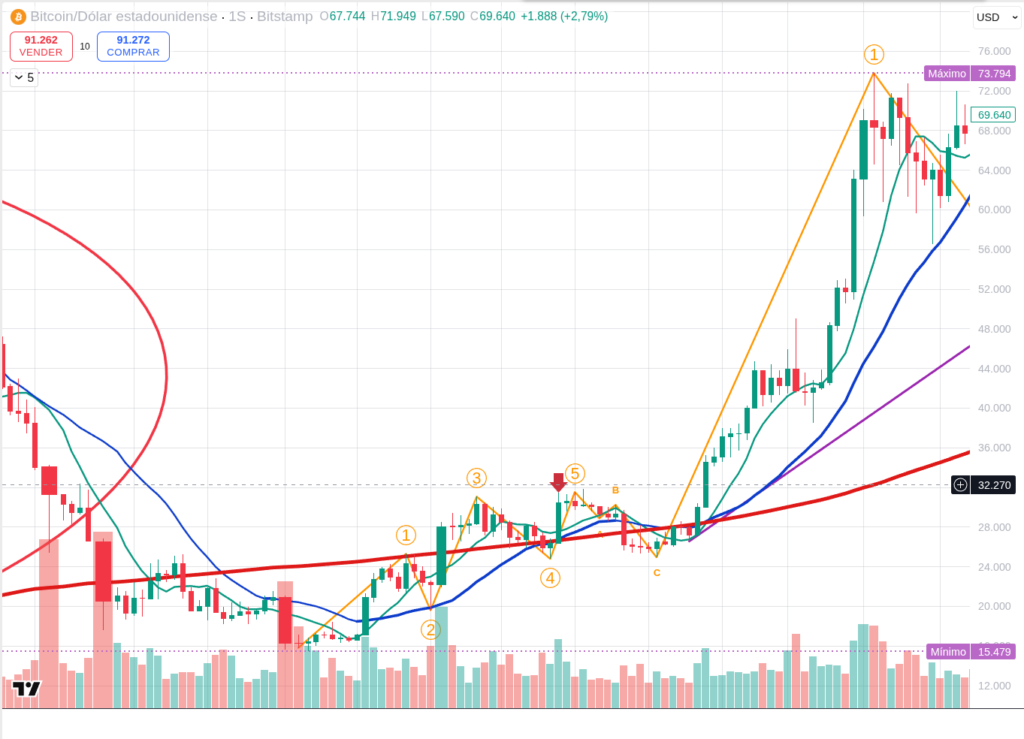
I have written before that the weekly bar chart for BTC appears to have painted a complete Elliott Wave impulse (1-2-3-4-5). This massive move carried the price from approximately $25,000 all the way to $125,000.
Context is everything. This wave was preceded by a similar, albeit smaller, impulsive move that took the price from $15,479 in November 2022 to a peak of $32,000 in July 2023, which then corrected in an ABC pattern back down to $25,000. As you know, market behaviors are fractal; they repeat themselves over and over again on different scales.
The “Wave B” Theory
My current theory is that Wave B of the correction has likely begun.
What does this mean? It suggests that after the recent drop (Wave A), the price will likely rebound or rally during the final weeks of 2025 and into early 2026. This is the “relief” phase that often tricks investors into thinking the bull run has fully resumed.
However, once this Wave B runs its course, the structure demands completion. This would lead to Wave C, likely occurring after the first quarter of 2026.
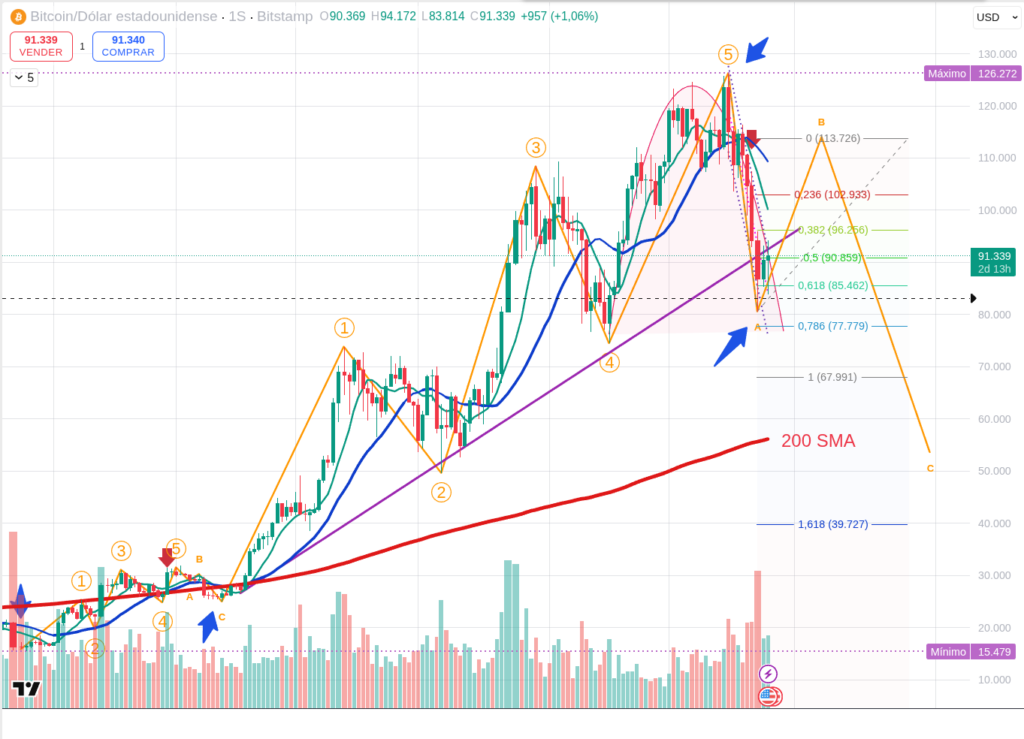
The Danger Scenario: Head & Shoulders
How Wave B develops remains to be seen. But the worst-case scenario (or best case, if you are prepared) is the formation of a massive Head and Shoulders pattern, with the right shoulder forming around $115,000.
If this structure plays out and resolves downwards, it could send the price to the mat—potentially targeting the $40,000 region.
That sounds terrifying to many, but knowing this “animal,” I doubt it would stay there for long. At $40k, it would face a horde of hungry buyers (institutional and smart retail) who would rapidly ignite a new impulsive wave. Or maybe not!? That is the beauty of the market; nothing is certain.
The “Baker” Indicator
We must wait patiently. But there is an additional factor adding fuel to the fire right now: Market Sentiment.
Suddenly, everyone is an expert on the subject. As the old saying goes (attributed to Joe Kennedy): “If the shoe shine boy (or the baker) is giving you stock tips, it’s time to sell.” When the general public is euphoric, the smart money is usually looking for the exit.
Let’s watch the weekly close closely.
Disclaimer: This content is for informational purposes only and represents personal observations and technical analysis. It does not constitute financial, investment, or trading advice. Please conduct your own research and consult a professional before making any financial decisions. For our full statement, please read our disclaimer here: https://tavoplus.com/disclaimer/