Hallo zusammen!
It’s Friday, November 21, 2025. Today, I want to discuss a potential reversal signal.
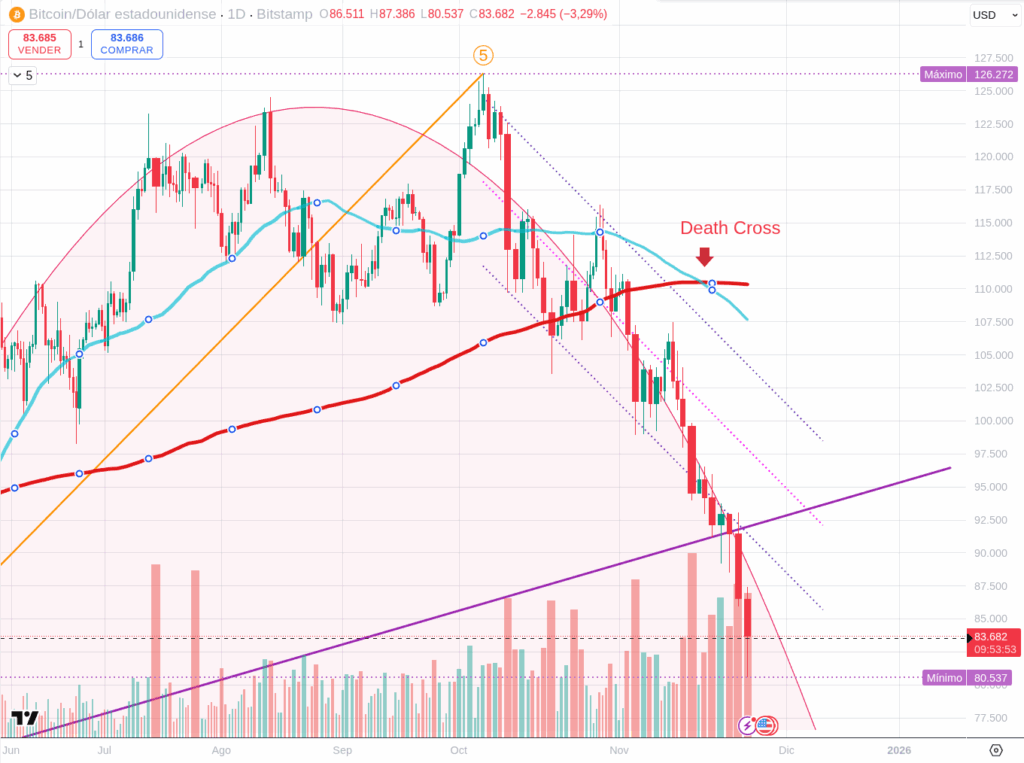
On November 16, a Death Cross occurred on the BTC daily chart (where the 50-day SMA crosses below the 200-day SMA). This signal is notoriously difficult to interpret correctly. Many traditional traders view it as a definitive bearish omen. However, in crypto, and specifically with Bitcoin, a Death Cross is often immediately followed by a significant bounce.
Furthermore, these digital assets have a specific characteristic: when a very sharp, violent movement occurs in one direction—like the drop we’ve seen over the past few days—a reactive counter-movement usually follows.
Today, BTC hit a low of $80,600. If you had told someone that price a week ago, they would have called you crazy. This drop was brutal. It didn’t just break the long-term bullish channel BTC has held since November 2023; it also abruptly shattered the daily bearish channel, pushing the price to an extreme with incredible velocity.
The Setup for a Bounce
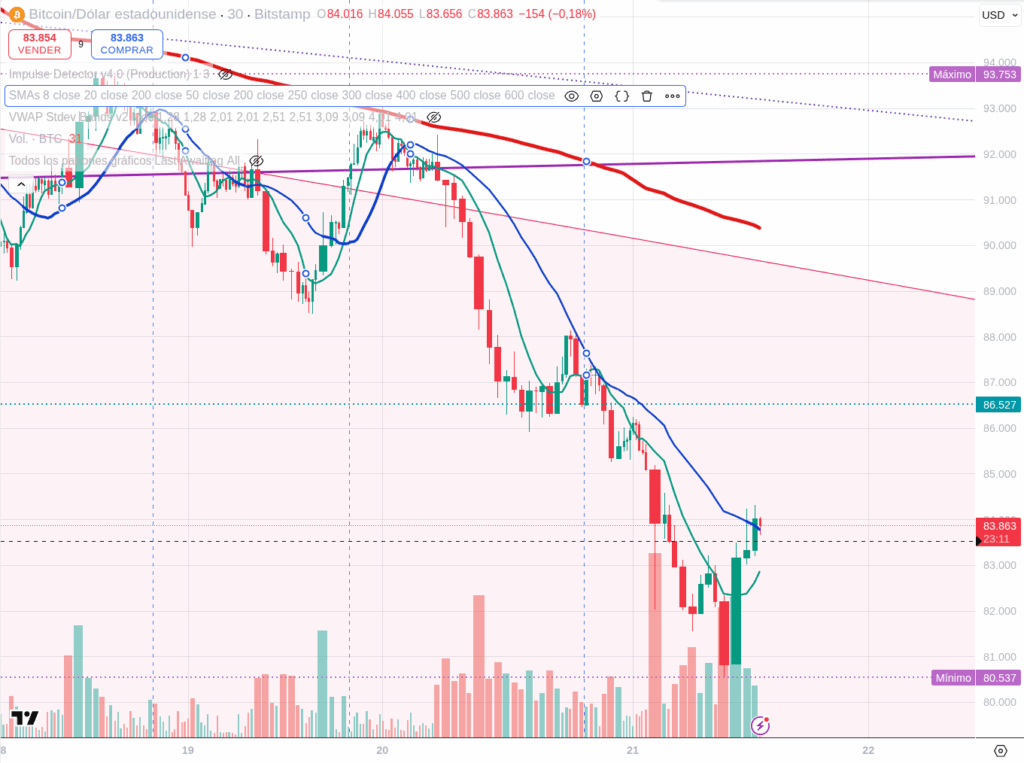
To me, this extreme extension is a signal that a short-term bounce could be imminent. If you look at the 30-minute and 1-hour charts, there are clear reversal signals forming. Of course, these must be validated throughout the day today. It might not happen—this is speculation—but if you take a calculated risk, there might be profit to be captured. (Note for myself: this is a trade idea, not investment advice).
Before, I wrote about the possible formation of an ABC correction. I now ask myself: Is this the end of Wave A, and are we beginning to form Wave B? Or, is this not an ABC correction at all, but a fiercer 1-2-3-4-5 downward impulse? It’s too early to tell.
Regardless, today I am going long, with strictly controlled risk. Why? Because while my main thesis remains unchanged—that the macro cycle is over—these oversold conditions present short-term opportunities.
The Macro Picture: Friday Data
Today, Friday, November 21, 2025, the economic calendar is relatively light but features key indicators of economic health.
- United States (9:45 AM ET): S&P Global Flash US Manufacturing and Services PMI. These preliminary readings provide a snapshot of business activity. The market will watch to see if the economy is cooling down significantly or remaining resilient, which impacts Fed expectations.
Markets are open as usual as we head into the weekend.
Technical Snapshot: Bouncing Off the Extremes (30-Min Charts)
We are seeing a significant bounce from the intraday lows. The question now is validation.
(Current reference prices: BTC ~$84,090, ETH ~$2,745, SOL ~$127.4, BNB ~$823. Remember, these are observations, not predictions.)
- BTC (Bitcoin): The rebound from $80,600 to $84,000 is substantial. We need to see the 1-hour chart higher lows confirmed to trust this bounce. The immediate battle is holding above $83,000.
- ETH (Ethereum): Like BTC, ETH is bouncing hard from extreme lows. It needs to reclaim $2,800 to gain any short-term bullish traction.
- SOL (Solana): High volatility continues. The bounce from the lows is aggressive. Watch for stability above $125.
- BNB (BNB): Still showing relative structural strength compared to the others, holding up better during the flush.
Final Thoughts: Calculated Risk
The violence of this drop suggests a reactive bounce is due. The daily Death Cross, paradoxically, supports this short-term view. I am taking a calculated, risk-managed long position today to capitalize on this potential counter-move, even while maintaining my long-term bearish view on the cycle.
Disclaimer: This content is for informational purposes only and represents personal observations and technical analysis. It does not constitute financial, investment, or trading advice. Please conduct your own research and consult a professional before making any financial decisions. For our full statement, please read our disclaimer here: https://tavoplus.com/disclaimer/