Good morning, traders and market watchers. Today feels like one of those pivotal days where the air is thick with anticipation. With the usual flow of economic data still hampered by the ongoing U.S. government shutdown, all eyes, and ears, are tuned into a few key events that could genuinely move the needle.
But beyond the scheduled news, there’s a feeling brewing in the crypto market—a quiet question forming in the back of my mind after watching recent price action, especially with Ethereum.
Let’s unpack the macro agenda, then dive into what the charts are really telling us, particularly with BTC and ETH.
The Macro Picture: Powell Takes Center Stage
🇺🇸 U.S.: Powell Speaks, Jobs Data Arrives
Today, the spotlight is firmly on Jerome Powell, the Fed Chair. His public intervention is a rare opportunity for markets to glean some genuine insight into the Federal Reserve’s thinking, especially without reliable economic data. We’ll be listening for any nuance regarding future rate cuts, inflation concerns, and how the FOMC views the current economic risks. His words could provide the directional clarity the market desperately needs.
Alongside Powell, we’ll get the Initial Jobless Claims data. This weekly snapshot of new unemployment filings is a highly sensitive indicator of the labor market’s health. Any significant deviation from expectations could trigger reactions in bonds, the dollar, and the stock market.
🇪🇺 Europe: Eurogroup Meets Amidst Cautious ECB Talk
In Europe, the Eurogroup is meeting to discuss macroeconomic and fiscal monitoring. While typically less dramatic than Fed events, these discussions can still offer insights into the bloc’s financial stability. Recent comments from ECB member José Luis Escrivá—suggesting rates are “at an appropriate level” and emphasizing flexibility—underscore a cautious, data-dependent stance from the European Central Bank.
Global Impact: EIA Crude Oil Inventories
Finally, the EIA Crude Oil Inventories report will hit today. This energy data can influence oil prices, impacting the energy sector and potentially feeding into broader inflation narratives.
Day’s Risk Summary: With the data pipeline still constricted, Powell’s words and the jobless claims become strategic focal points. In Europe, the Eurogroup meeting could add local volatility. The market will be hyper-sensitive to tone, language, and subtle shifts in perspective today.
My Personal Market Read: Is a Correction Looming?
This brings me to my personal observation, a feeling that’s been growing stronger: I can’t shake the idea that the market might be gearing up for a correction.
Why this sentiment?
Firstly, the persistent struggle of ETHUSDT. It has now failed to decisively clear its All-Time High (ATH) resistance on four separate occasions, with yesterday being the most recent rejection at ~$4760. When a major level holds up that many times, it’s a powerful signal that sellers are defending it vigorously.
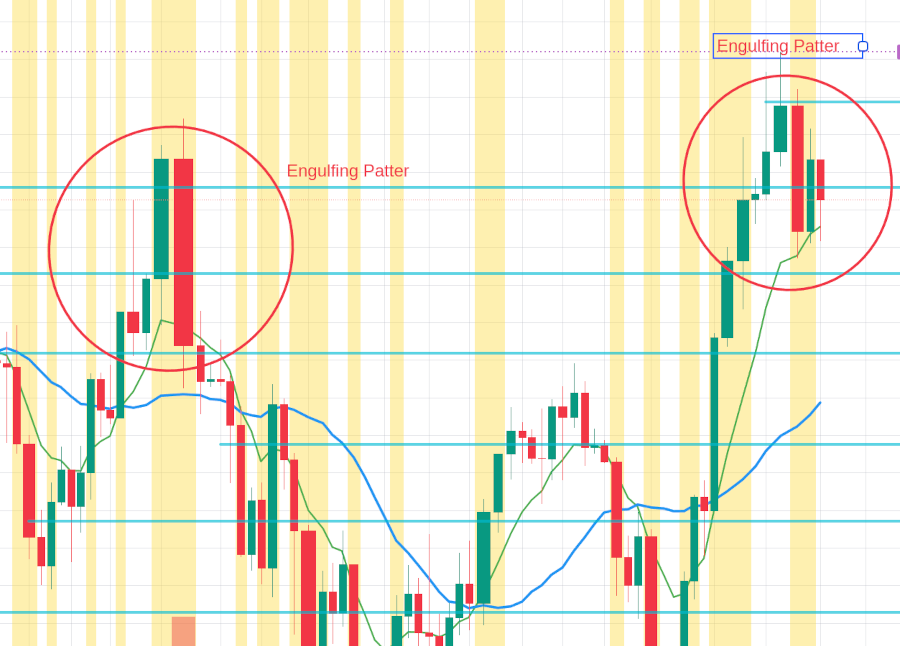
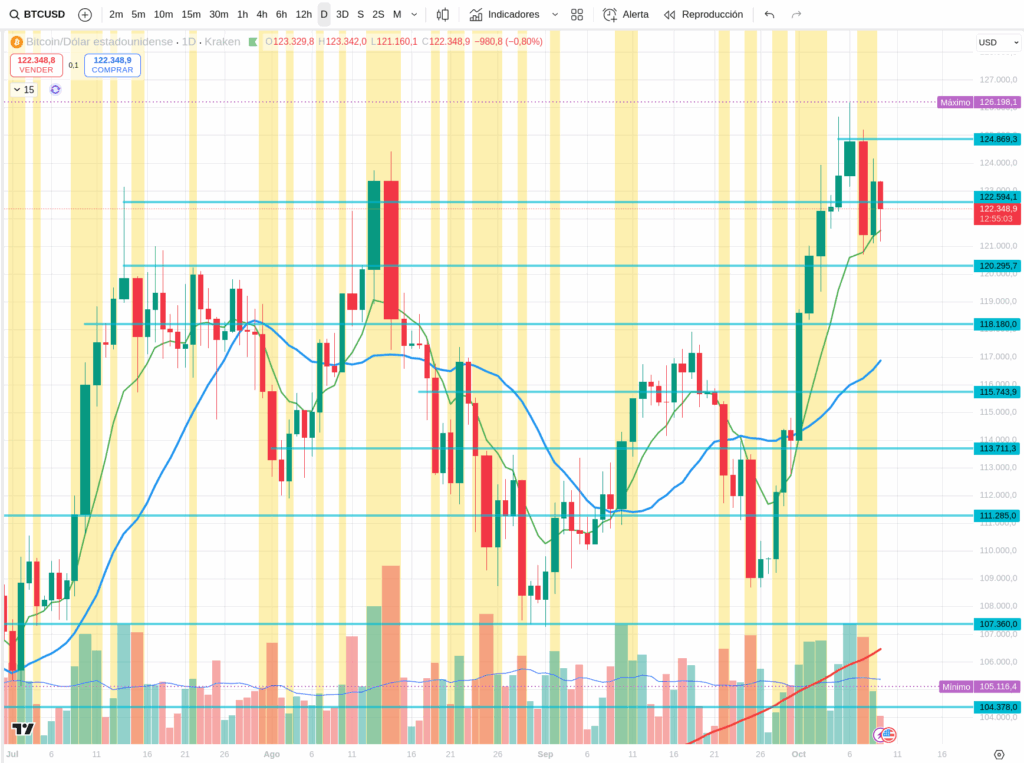
Secondly, Bitcoin’s recent rally, while impressive in taking us towards $125,000, has also started to show some signs of fatigue. What really catches my eye are the engulfing bearish patterns on the daily chart for BTC. Bitcoin is the king, the ultimate market dictator, and when its daily chart starts flashing these kinds of reversal patterns, it demands attention.
A quick note on these patterns: In traditional markets, an “engulfing” pattern often involves a price “gap” where today’s open is higher than yesterday’s close. However, in continuous 24/7 markets like crypto, these gaps are rare. Instead, we look for the body of the bearish candle to fully overlap and exceed the body of the preceding bullish candle, signaling a strong shift in sentiment even without an opening gap.
It makes me wonder if we’re facing a potential market top, or at least a significant pause. We’ll need to closely watch how price reacts over the next few days.
Technical Analysis: Price Action + Indicators (30-Min Charts)
Let’s ground these observations with a look at the 30-minute charts, combining pure price action with insights from RSI, MACD, and moving averages.
(Current BTC reference price: ~$122,045 USD. Remember, these are observations, not predictions.)
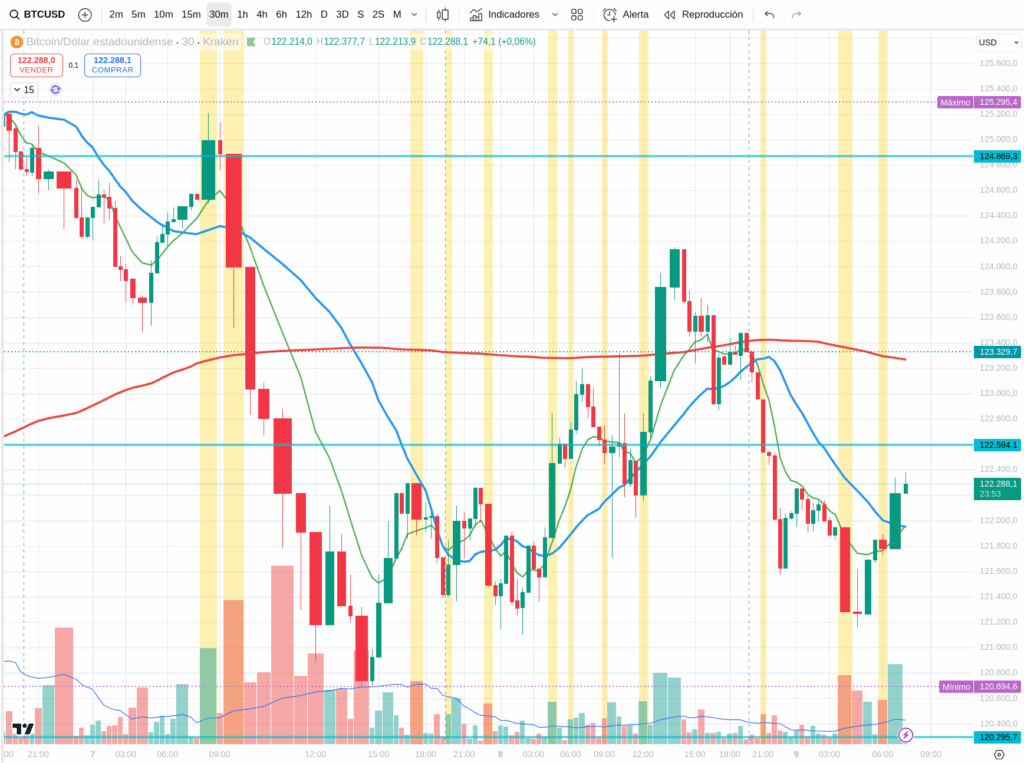
BTCUSDT (30 min)
- Strong Resistance: ~$123,800 – $124,500
- Pivot Zone / Control Area: ~$121,500 – $122,800
- Key Support: ~$120,000 – $121,300
Price Action & Patterns: * A clean break above $123,800 with good volume and a solid candle body would suggest bullish continuation towards $124,500+. * Conversely, if price approaches this resistance and forms candles with long upper wicks, it’s a clear sign of seller pressure stepping in. * On the downside, a decisive break below $121,500 with a strong bearish candle could trigger a move towards the $120,000 support.
Indicators (RSI, MACD, MAs): * RSI: Watch if it pushes towards 70 and then rejects, signaling potential overbought conditions. A neutral zone (40-60) leaves room for movement either way. * MACD: A MACD line crossing above its signal line indicates bullish momentum; a cross below points to weakening momentum. * Moving Averages (e.g., 50/200 MA): A bullish crossover (MA50 above MA200) confirms positive bias; the opposite signals a bearish shift.
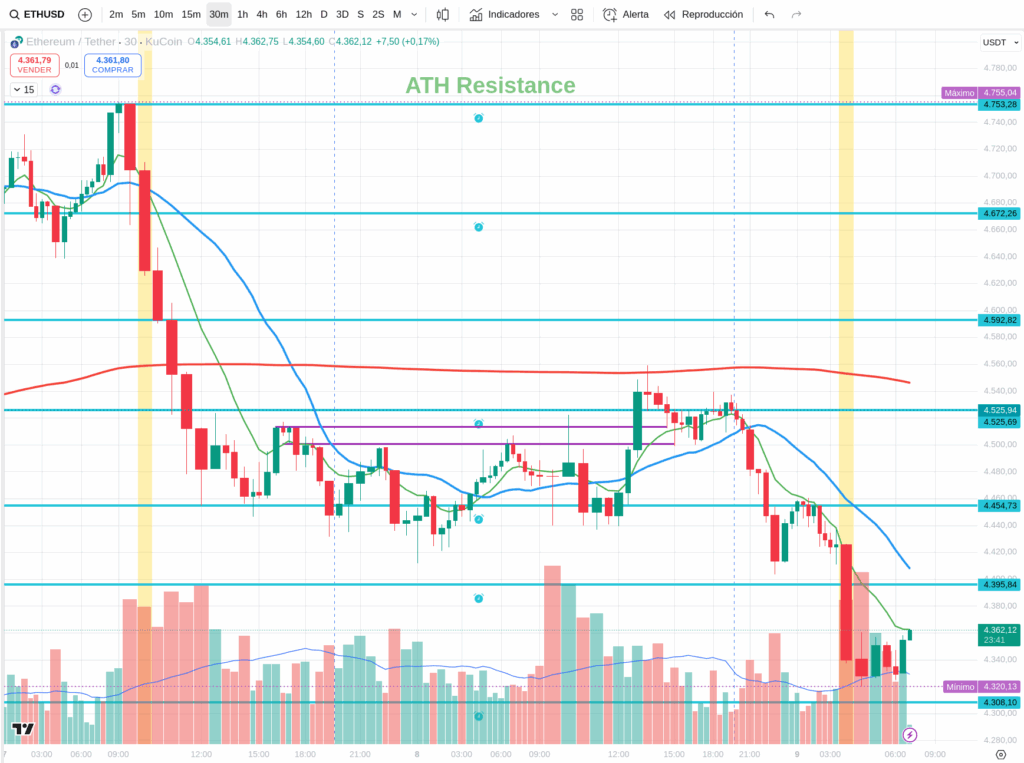
ETHUSDT (30 min)
- Immediate Resistance: ~$4,450 – $4,550 (This is below the critical $4760 level mentioned earlier, showing it’s still trading within a range, now further compressed.)
- Intermediate Zone: ~$4,300 – $4,400
- Strong Support: ~$4,050 – $4,250
Price Action & Patterns (within the consolidation context): * A strong candle closing above $4,550 could signal a temporary push higher, possibly towards the $4760 wall once again.
- Long upper wicks when testing **$4,550** would imply continued rejection within the range. * A decisive candle close below $4,300 would increase the likelihood of a move towards the stronger support at $4,050-$4,250.
Indicators (RSI, MACD, MAs): * RSI: If it approaches 70 and rejects, it could indicate short-term exhaustion. * MACD: A bullish cross reinforces upward movement; a bearish cross suggests vulnerability. * Moving Averages: An MA50 crossing above MA200 would suggest a stronger bullish structure, while the opposite would weaken it.
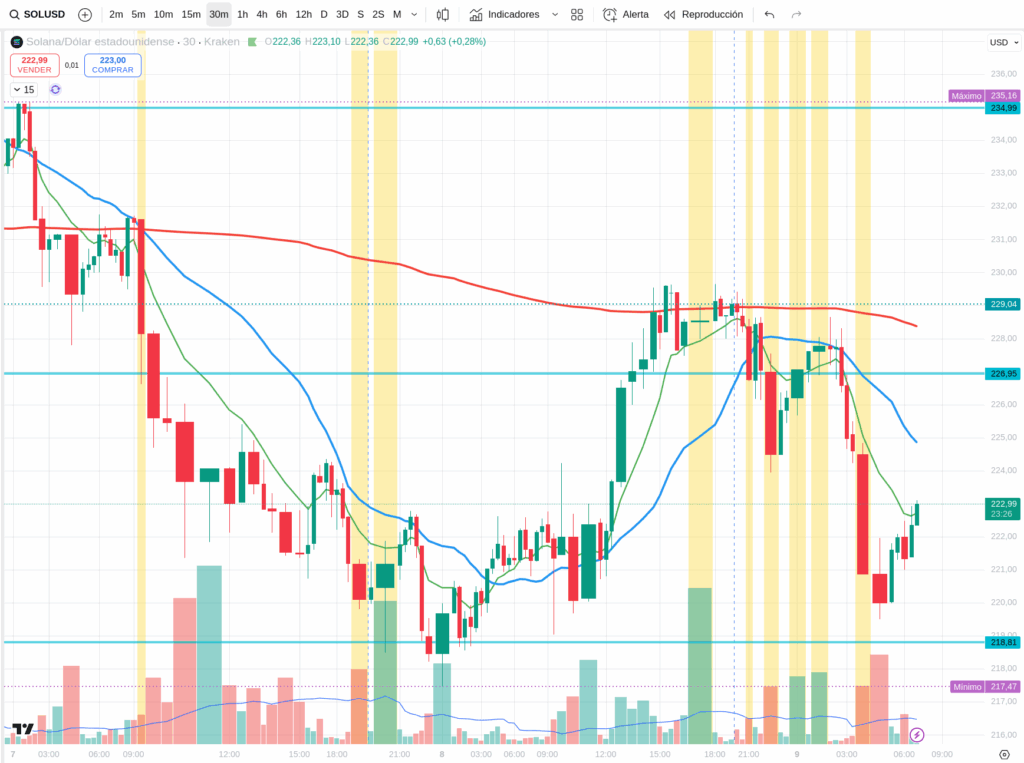
SOLUSDT (30 min)
- Key Resistance: ~$230 – $240
- Mid-Level Control Zone: ~$220 – $228
- Significant Support: ~$200 – $215
Price Action & Patterns: * A strong candle close above $240 with minimal upper wick would indicate a potential continuation towards $250+.
- Rejection at the **$230-$240** zone, with long upper wicks, points to strong seller presence. * A powerful bearish candle closing below $220 could accelerate a move towards the $200-$215 support zone.
Indicators (RSI, MACD, MAs): * RSI: Nearing 70 and reversing can signal a technical top. * MACD: A bullish cross could confirm a rally; a bearish cross warns of momentum loss. * Moving Averages: An MA50 bullish cross over MA200 confirms underlying strength; a bearish cross would indicate weakness.
Final Thoughts for Today
Today is about observing reactions. Powell’s speech and the jobless claims will dictate the immediate sentiment. For crypto, price action remains paramount. Given the persistent resistance at ETH’s ATH and those engulfing patterns on BTC’s daily chart, I believe caution is warranted.
Use RSI, MACD, and moving averages as filters, but always prioritize what the raw price action is telling you. Confirmations are key; avoid anticipating moves without solid evidence.
Disclaimer: This content is for informational purposes only and represents personal observations and technical analysis. It does not constitute financial, investment, or trading advice. Please conduct your own research and consult a professional before making any financial decisions. For our full statement, please read our disclaimer here: https://tavoplus.com/disclaimer/
Related posts:
 Market Analysis (October 8, 2025): The Market Holds its Breath for Fed Minutes as Ethereum Rejects a Key Level Again
 Market Analysis (October 13, 2025): Tariffs Shock, Columbus Day Calm, and the Whispers of a Bear Market
 Market Analysis (October 15, 2025): High Volatility Continues – Navigating the Crypto Rollercoaster