


Hello everyone!
The continuity of major announcements being delayed due to the ongoing government shutdown is painting a clear picture of uncertainty in the markets. This isn’t just a minor inconvenience; it means that when this event finally concludes, markets will likely be far more sensitive, potentially triggering abrupt and explosive movements as all that pent-up information gets released.
Yesterday felt like déjà vu, reminiscent of the day the AWS event unfolded. The markets started beautifully, with many crypto assets showing strong positive momentum – seemingly solid, especially for BTC and ETH. Yet, as the midday hours approached, everything unraveled. Prices reversed sharply, erasing all the hard-won gains of the morning.
This behavior, though frustrating, isn’t surprising. Both Bitcoin and Ethereum, despite their perceived strength, can experience highly explosive sudden movements. But if these surges aren’t accompanied by a solid fundamental base – a clear “why am I reacting like this?” reason – it’s highly probable that the price will simply retrace back to its origin. What we saw yesterday was exactly that: a move lacking conviction, easily unwound.
However, amidst this short-term volatility, I’ve been doing some deeper digging. Looking at the daily chart, I perceive a potential bull flag formation. This led me to zoom out even further, to the weekly and monthly charts, and what I observed is quite interesting, especially through the lens of Elliott Wave Theory.
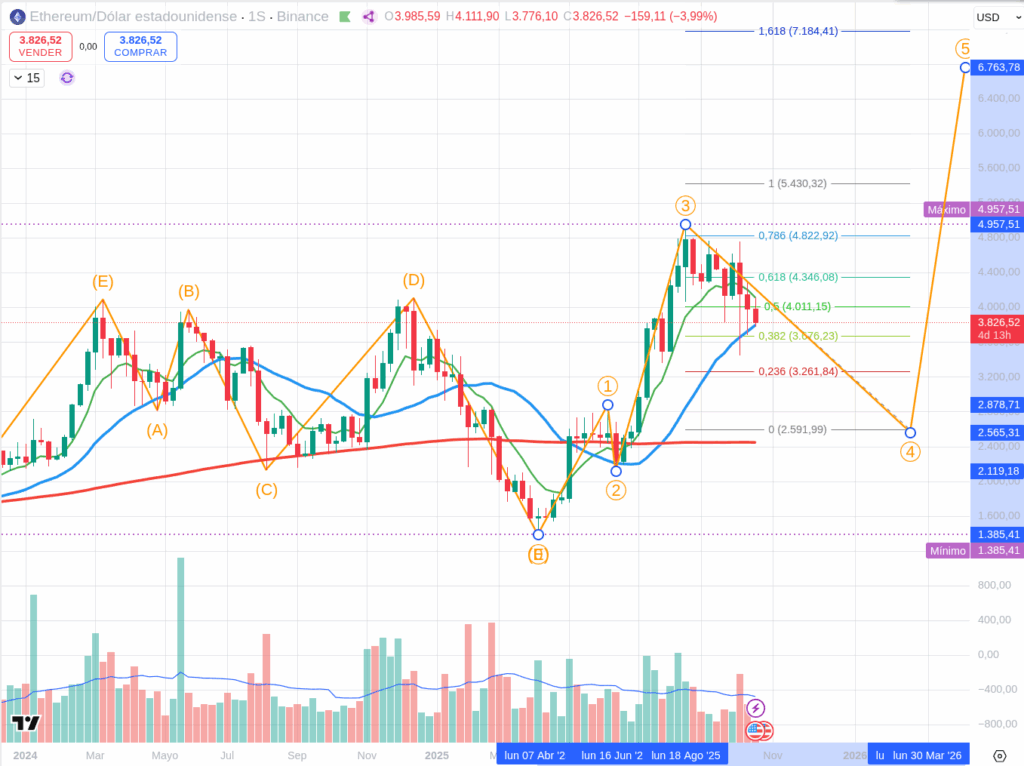
Now, let me be clear: I am not an Elliott Wave expert, and the interpretation of these waves can be highly subjective. But what I perceive for ETHUSDT is that we might be forming the correction of the 4th impulse phase. If this theory holds true, it could potentially drive the price down to around $2,600.
This might sound alarming, but if this 4th wave correction does confirm and complete, it could lay a very strong foundation – a solid support base – for Ethereum to then propel much further, potentially beyond $6,000 in the future (though we’re talking many months down the line).
Again, this is just a theory, my point of view today. It’s not a certainty, and my perspective could shift in a few days. But it’s a scenario worth contemplating for those with a longer-term horizon.
The Macro Landscape: Uncertainty Reigns, Technicals Lead
Today’s session is another quiet one on the macroeconomic front.
- No high-impact announcements are expected from the U.S. or Europe today. Even events like “Existing Home Sales” are scheduled for later in the week, not now.
- However, the persistent U.S. government shutdown continues to delay crucial economic data. This constant “data void” creates an environment where markets are inherently more fragile and susceptible to technical movements or shifts in sentiment rather than fundamental news.
Operational Implication: With no major catalysts, technical flows, risk perception (risk-on/risk-off sentiment), and liquidity will dictate market action. For us, this means precision in technical analysis is paramount. The market is operating in a state of suspended animation, making any future data release, once the shutdown ends, a potential trigger for abrupt moves.
Technical Analysis: Observing the Battle (30-Min Charts from Binance)
Let’s look at the charts, keeping in mind the volatility of yesterday and the long-term potential for ETH, using your latest price updates.
(Current reference prices: BTC ~$108,000, ETH ~$3,830, SOL ~$185.55. Remember, these are observations, not predictions or recommendations.)
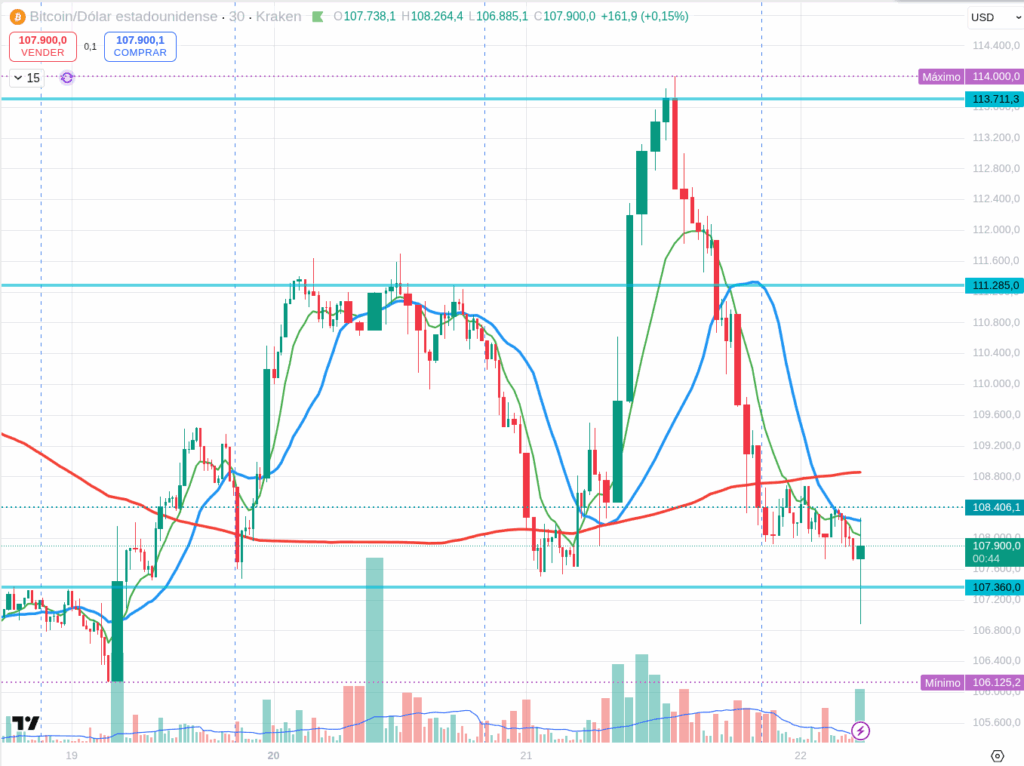
BTCUSDT (30 min)
Bitcoin, currently around $108,000, is showing signs of consolidation after yesterday’s reversal.
- Immediate Resistance: ~$109,000 – $110,500
- Pivot / Control Zone: ~$107,500 – $108,500
- Key Support: ~$105,500 – $107,000
What to Watch: * BTC is currently hovering near its pivot. For bullish momentum to gain, a clean close above $108,500 and then challenging the $109,000 resistance would be needed. * If price is rejected from the $108,500-$109,000 zone, it signals sellers are defending it. * On the downside, a decisive break and close below $107,500 could open the path towards the $105,500-$107,000 support area.
Indicators: RSI (30m) is likely attempting to find direction near the neutral zone. MACD needs to show a clear bullish cross and sustain it. Vigilance for false breakouts is key.
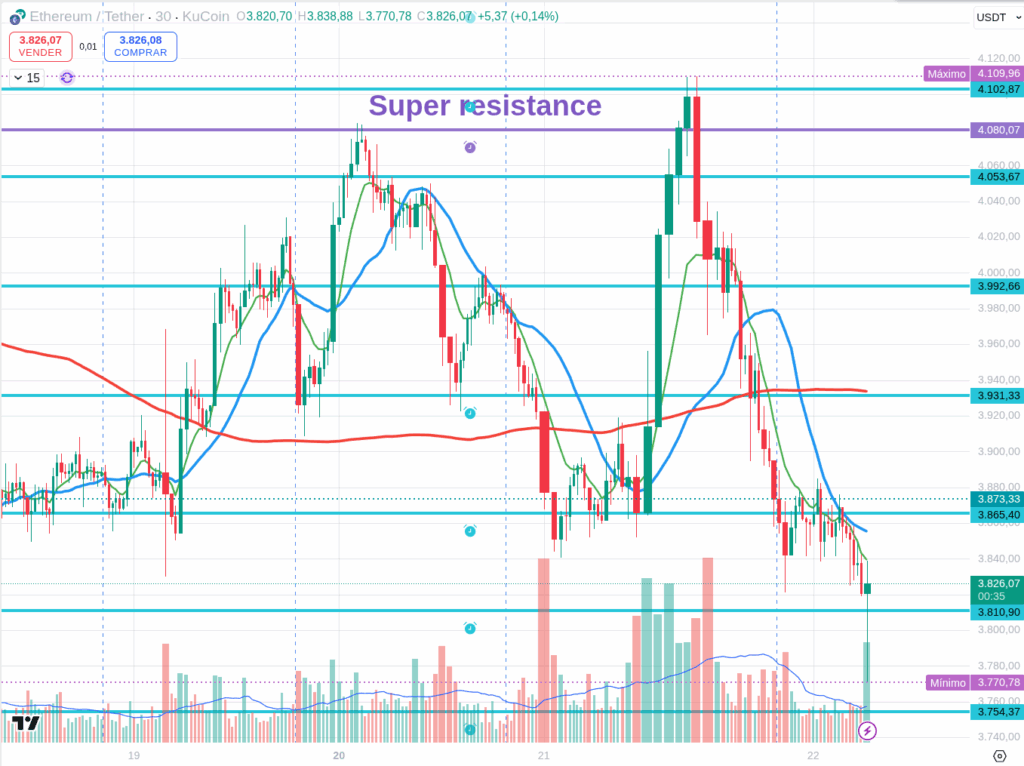
ETHUSDT (30 min)
Ethereum, trading around $3,830, is consolidating after its move yesterday, and we remain vigilant for the continuation of the Head & Shoulders pattern and the Elliott Wave potential.
- Immediate Resistance (Former Neckline Area): ~$3,900 – $3,950
- Pivot / Control Zone: ~$3,800 – $3,850
- Key Support / Target Zone: ~$3,750 – $3,780 (encompassing the H&S $3,760 target)
What to Watch: * ETH is currently battling around its pivot. A decisive break and close below $3,800 would suggest further downside in line with the H&S projection. * The $3,900-$3,950 area now acts as strong immediate resistance (former neckline territory). Rejection from here would reinforce the bearish outlook. * The $3,750-$3,780 zone, which includes the H&S pattern’s $3,760 target, is the critical area to watch for as the price approaches.
Indicators: RSI (30m) will likely show a bearish trend, possibly nearing oversold territory if further downside confirms. MACD is crucial here for confirming bearish momentum – a sustained negative divergence or strong cross below zero would add confluence.
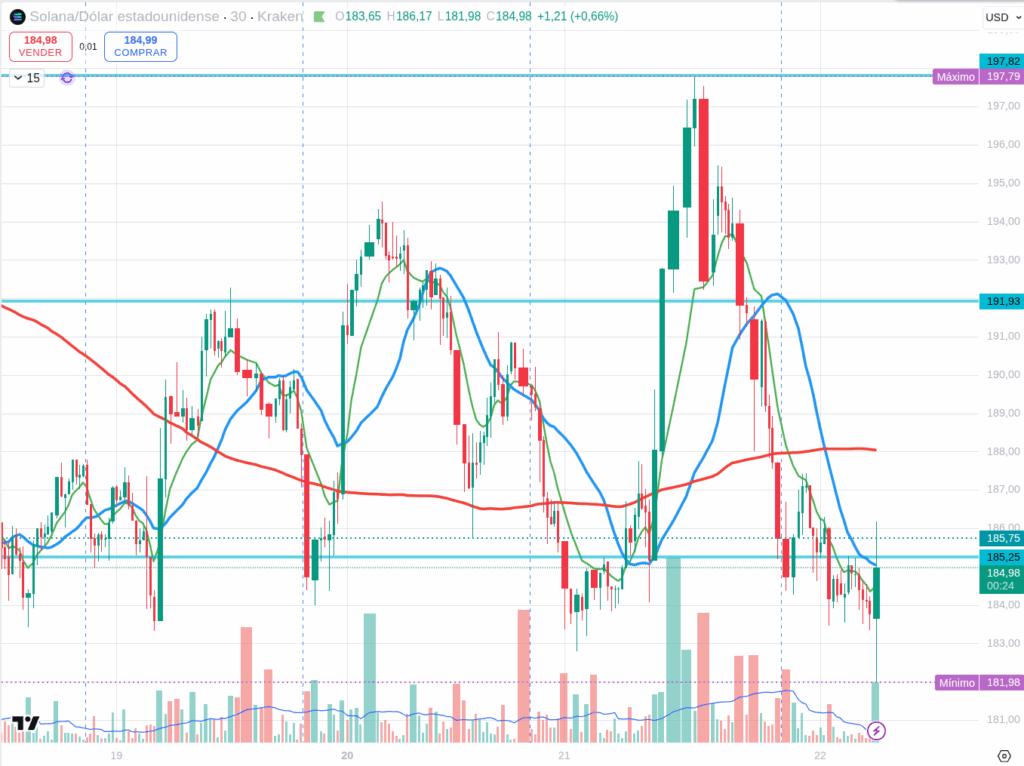
SOLUSDT (30 min)
Solana, currently around $185.55, has also seen a similar pullback and is in a consolidation phase.
- Immediate Resistance: ~$188 – $192
- Pivot / Control Zone: ~$184 – $187
- Key Support: ~$178 – $182
What to Watch: * For a sustained move higher, SOL needs a convincing close back above $187 and then a challenge of the $188-$192 resistance zone. * Rejection (long upper wicks) near $187-$188 would suggest sellers are defending this area. * A break and close below $184 with volume could lead to a test of the $178-$182 support.
Indicators: RSI (30m) will reflect its current momentum. MACD needs to show conviction for any bullish continuation, or bearish confirmation if it crosses down.
Final Thoughts: Patience Amidst Uncertainty
Today, the market demands patience. The lack of macro news, coupled with the fragility seen yesterday, means that confirmed price action, not assumptions, should drive our decisions. For ETH, the short-term bearish signal from the H&S pattern (targeting $3,760) and the longer-term Elliott Wave theory (potential $2,600 correction before $6,000+) paint a complex, but potentially rewarding picture for the patient.
Watch the levels carefully. In this environment, “waiting” for clarity and strong confirmations, rather than chasing fleeting movements, remains the most prudent strategy.
Disclaimer: This content is for informational purposes only and represents personal observations and technical analysis. It does not constitute financial, investment, or trading advice. Please conduct your own research and consult a professional before making any financial decisions. For our full statement, please read our disclaimer here: https://tavoplus.com/disclaimer/