
Hello everyone!
Yesterday started beautifully for ETHUSDT. Everything seemed poised for a bright day across the crypto market. But then, something happened that often goes unnoticed by macro-analysts but can have a profound impact on highly interconnected digital assets: the significant outage in the US-EAST-1 region of Amazon Web Services (AWS).
This event immediately made me wonder: Could this AWS issue have turned what looked like a promising day into a gray (or even red) one for ETHUSDT and other altcoins?
For Bitcoin (BTC), the answer is likely “no.” We already know the sheer robustness of Bitcoin’s infrastructure, backed by thousands of decentralized nodes and miners globally – and yes, I’m proud to be one of them! This distributed nature makes BTC incredibly resilient to single points of failure.
However, the case for Ethereum (ETH) is quite different. There’s a widely discussed statistic that a high percentage, approximately 37%, of Ethereum’s “execution layer” validator nodes might be running on AWS. When a critical region like US-EAST-1 experiences major disruptions – with DNS failures, overloads in services like DynamoDB and APIs – this absolutely could lead to:
- Delays in exchange operations: Centralized exchanges (CEXs) like Coinbase and Robinhood, which often rely on AWS, reported issues with access, order processing, and more. This directly impacts liquidity and execution.
- Validation delays or perceived instability: Even if the core Ethereum blockchain keeps producing blocks (which it did), if a large portion of the access infrastructure (wallets, dApps, Layer-2 solutions, data query services like Infura) is degraded due to AWS, it creates perceived instability. Users might not see their balances correctly, transactions might hang, generating panic and perceived technical risk.
- “Fear Factor” Amplification: The crypto market is incredibly sensitive to fear and uncertainty. When a core piece of infrastructure falters, traders might anticipate worse and sell off out of caution, even if the underlying asset isn’t fundamentally compromised.
So, is it reasonable to say the AWS outage “contributed significantly” to ETH’s difficulties yesterday? Absolutely, yes. Reduced liquidity, execution errors, perceived technical risk, and a surge in fear could very well have weighed heavily on ETH’s price, turning a promising start into a challenging day.
This highlights a critical vulnerability for parts of the crypto ecosystem that rely heavily on centralized cloud providers, a stark contrast to Bitcoin’s decentralized strength.
The Macro Landscape: A Quiet Day, Yet Data Void Lingers
Today, the macroeconomic calendar is relatively calm, with no major “market-moving” announcements expected from the U.S. or Europe.
- For instance, Existing Home Sales are on the U.S. calendar for later, but not today.
- However, the persistent U.S. government shutdown continues to delay crucial economic data (like inflation and employment figures), creating an underlying layer of uncertainty.
Operational Implication: In the absence of strong catalysts, market flow, risk perception, and technical levels will play an even greater role. The lingering AWS issues could also keep traders on edge, adding an unexpected “tech risk” layer to the session, particularly for assets like ETH.
Technical Analysis: Head & Shoulders on ETH Targeting $3,760 (30-Min Charts from Binance)
Let’s look at the charts, keeping in mind the AWS context for ETH, and using your latest price updates.
(Current reference prices: BTC ~$107,800, ETH ~$3,872, SOL ~$185.62. Remember, these are observations, not predictions or recommendations.)
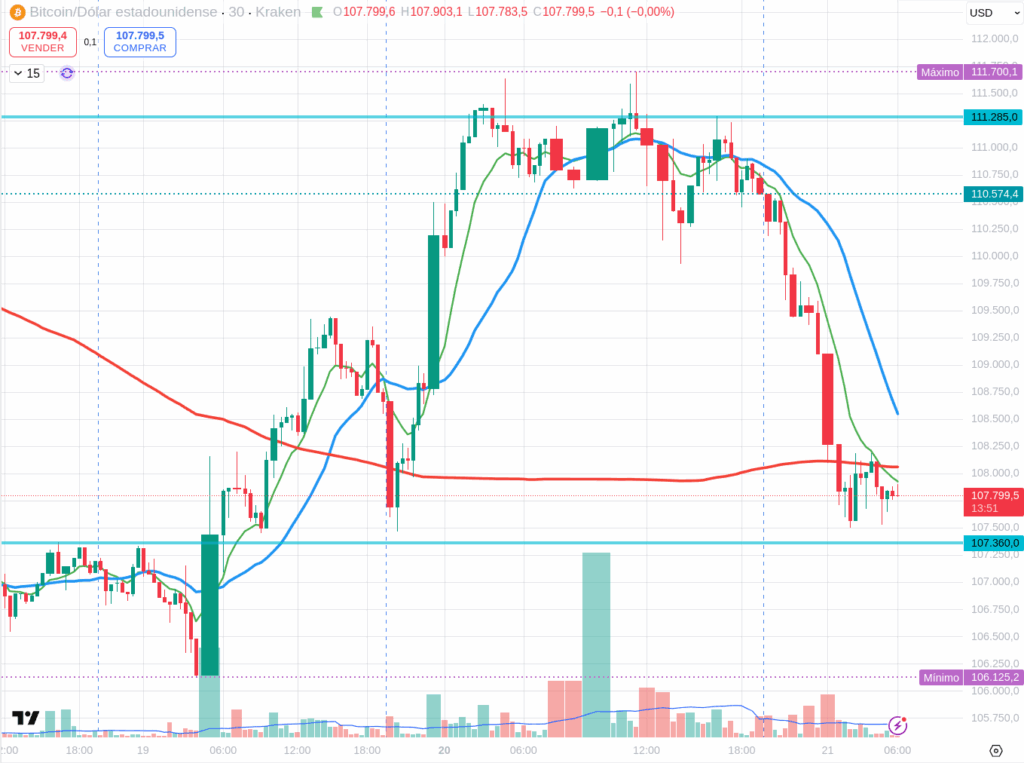
BTCUSDT (30 min)
Bitcoin, currently around $107,800, has seen a slight pullback, now testing a crucial pivot zone.
- Immediate Resistance: ~$109,000 – $110,500
- Pivot / Control Zone: ~$107,500 – $108,500
- Key Support: ~$105,500 – $107,000
What to Watch: * BTC is currently battling within its pivot zone. For bullish sentiment to resume, a clean close above $108,500 and then challenging the $109,000 resistance would be needed. * If price is rejected from the $108,500-$109,000 zone, it suggests sellers are still present. * On the downside, a decisive break and close below $107,500 could open the path towards the $105,500-$107,000 support area.
Indicators: RSI (30m) will be trying to find direction near the neutral zone. MACD needs to show a clear bullish cross and sustain it to confirm upward momentum.
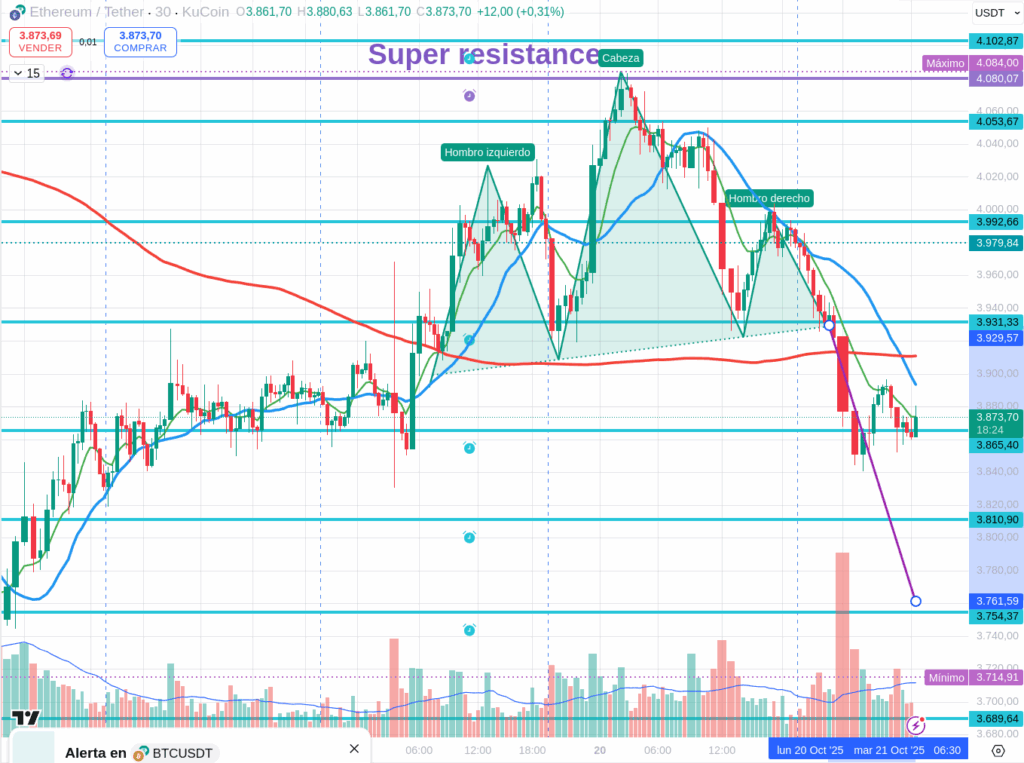
ETHUSDT (30 min)
Ethereum, trading around $3,872, is now decisively below its “super-resistance” and appears to be confirming the Head & Shoulders pattern on the 30-minute chart. The price action suggests the pattern has initiated its projected move, with an implied target of $3,760.
- Immediate Resistance (Projected Neckline Break): ~$3,950 – $4,000
- Current Battleground / Pivot: ~$3,860 – $3,890 (where price is currently fighting at $3,865 support)
- Key Support / H&S Target Zone: ~$3,750 – $3,780 (encompassing the $3,760 target)
What to Watch: * The Head & Shoulders pattern now appears to be in play. The immediate resistance zone ($3,950-$4,000) would be the area where a retest of the broken neckline might occur. Rejection from here would reinforce the bearish outlook. * The price is currently fighting at $3,865, a crucial immediate support. A decisive break and close below $3,860 would confirm further downside towards the H&S target. * A break below the current support of $3,865, especially with volume, would strongly suggest the pattern is unfolding, making the $3,760 target (and the $3,750-$3,780 zone) the next key area to watch.
Indicators: RSI (30m) will likely show a bearish trend, possibly entering oversold territory if the H&S plays out. MACD is crucial here for confirming bearish momentum – a sustained negative divergence or strong cross below zero would add confluence.
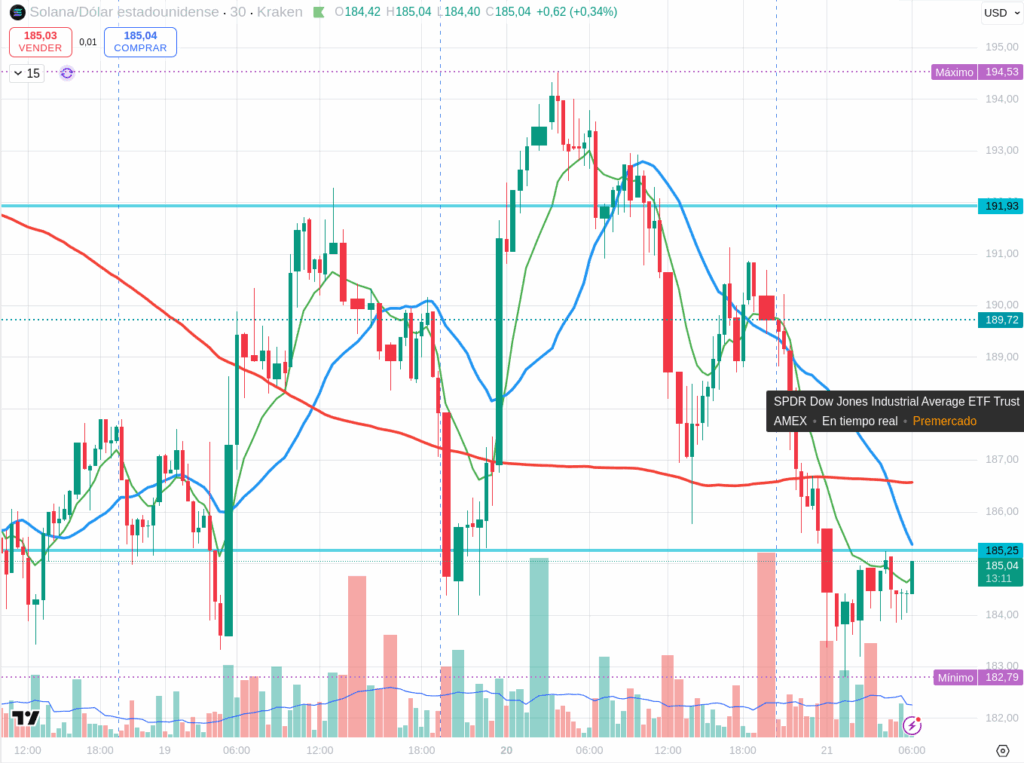
SOLUSDT (30 min)
Solana, currently around $185.62, has also seen a pullback, now challenging its pivot zone.
- Immediate Resistance: ~$188 – $192
- Pivot / Control Zone: ~$184 – $187
- Key Support: ~$178 – $182
What to Watch: * For a sustained move higher, SOL needs a convincing close back above $187 and then a challenge of the $188-$192 resistance zone. * Rejection (long upper wicks) near $187-$188 would suggest sellers are defending this area. * A break and close below $184 with volume could lead to a test of the $178-$182 support.
Indicators: RSI (30m) will reflect its current momentum. MACD needs to show conviction for any bullish continuation, or bearish confirmation if it crosses down.
Final Thoughts: Watch the American Open & the AWS Shadow
Today, the U.S. market opening will be crucial. For ETH, the Head & Shoulders pattern now appears to be confirming its bearish projection, with a clear target of $3,760. The current fight at the $3,865 support is critical. This, exacerbated by the lingering shadow of AWS issues, could still be influencing sentiment and technical performance. The fact that AWS problems might persist adds a unique layer of uncertainty to Ethereum specifically.
My approach for today remains cautious, especially for ETH given its technical setup and the cloud infrastructure concerns. For BTC and SOL, watch for clear breakouts or rejections from the defined levels. For ETH, pay very close attention to that $3,865 support and the projected H&S target – a decisive break could confirm a significant bearish move. Let the market speak, and be ready to react, not predict.
Disclaimer: This content is for informational purposes only and represents personal observations and technical analysis. It does not constitute financial, investment, or trading advice. Please conduct your own research and consult a professional before making any financial decisions. For our full statement, please read our disclaimer here: https://tavoplus.com/disclaimer/