Good morning, traders and market watchers! First off, a sincere apology for the delay in today’s publication. I was tied up in a business meeting that ran longer than anticipated. Thank you for your understanding and patience.
Now, let’s dive into the markets, because we have a lot to unpack. Today, we’re navigating a very unique landscape: Columbus Day in the U.S. (which means bond markets are closed, but equities are open), persistent government shutdown effects, and crucially, the aftershocks of a major political announcement that sent tremors across the globe.
After watching the dust settle, and with a keen eye on ETH’s continued struggles and BTC’s recent patterns, I can’t help but feel we might be at the precipice of a bear market. Let’s explore why.
The Macro Picture: Tariffs Shock the System
🇺🇸 The Tariff Bomb and Market Fallout
The biggest news dominating headlines and driving market action into today is the President’s recent announcement of new tariffs on China. This came as an unexpected blow to market sentiment, and we saw an immediate and significant reaction across the board.
- Nasdaq: Fell sharply, around 3.5%.
- S&P 500: Experienced a significant drop, approximately 2.8%.
- Dow Jones Industrial Average (DJIA): Saw a notable decline of about 2.5%.
This is precisely the kind of unexpected “black swan” event that can fundamentally shift market dynamics. Historically, increased trade tensions and tariffs are viewed very negatively by markets, as they can disrupt supply chains, increase costs, and ultimately harm corporate earnings and economic growth. This is a very real headwind for the American market.
Alongside this, our old friend, the U.S. government shutdown, continues to delay crucial economic data. This means markets are flying somewhat blind, making them even more susceptible to major news like tariff announcements.
🇪🇺 Europe: A Quieter Day, But Next Week Holds Key Data
On the European front, today’s calendar is relatively light on high-impact macro data. However, looking ahead, we have important CPI (inflation) reports from Germany and the Eurozone this coming Tuesday, which will be crucial for assessing the ECB’s stance.
Crypto’s Reaction: Unsurprisingly, cryptocurrencies, being global and sensitive assets, also saw a significant downturn mirroring the traditional markets. This reinforced my earlier concerns about a potential broader correction.
Today’s Macro Conclusion: The tariff announcement is a massive negative catalyst, overshadowing almost everything else. While we might see a natural bounce today as markets digest the initial shock of such an unexpected event, I view this bounce with extreme skepticism. The underlying cause for the drop is very real, and not just a temporary FUD (Fear, Uncertainty, Doubt) event.
My Personal Market Read: Are We Entering a Bear Market?
Today, my instinct tells me to observe the “bulls” from a safe distance. We’ve seen a significant market drop, which is a natural reaction to the unexpected tariff news. A bounce back is also quite natural after such a sharp decline, as some participants might see it as a buying opportunity or simply a technical rebound.
However, I can’t shake the feeling that this might be more than just a temporary setback. The combination of ETHUSDT failing to break its All-Time High (ATH) resistance on four separate occasions (as discussed in previous analyses), a long run-up by BTC that reached $125,000, and now these major tariff shocks, makes me seriously question if we are on the cusp of a bear market.
Adding to this, those bearish engulfing patterns I observed on the daily chart for BTC, the undisputed queen of the crypto market, are powerful signals. When the leader starts flashing such strong reversal signs after a major rally, it truly dictates the ultimate direction of the market. This isn’t just FUD; it’s a fundamental shift in perception triggered by a real economic threat.
And here’s another historical nugget that keeps me cautious: We know that when the Federal Reserve eventually begins to lower interest rates, this move, often intended to stimulate a flagging economy, has historically preceded or coincided with further market downturns or the onset of a bear market. It’s a counterintuitive pattern: the Fed cuts rates, and the market, instead of rejoicing, often falls. This isn’t to say it will happen this time, but as traders, we must look at the market with the eyes of reality, not with the eyes of what we wish to see. This is an eventuality that could very well play out.
We must wait for the reactions over the coming days, but my bias is leaning towards caution.
Technical Analysis: Structural Pressure (30-Min Charts)
Given the current pressure, our technical analysis becomes a crucial guide, focusing on immediate support and resistance zones.
(Current BTC reference price: ~$114,924 USD. These are observations, not predictions or recommendations.)
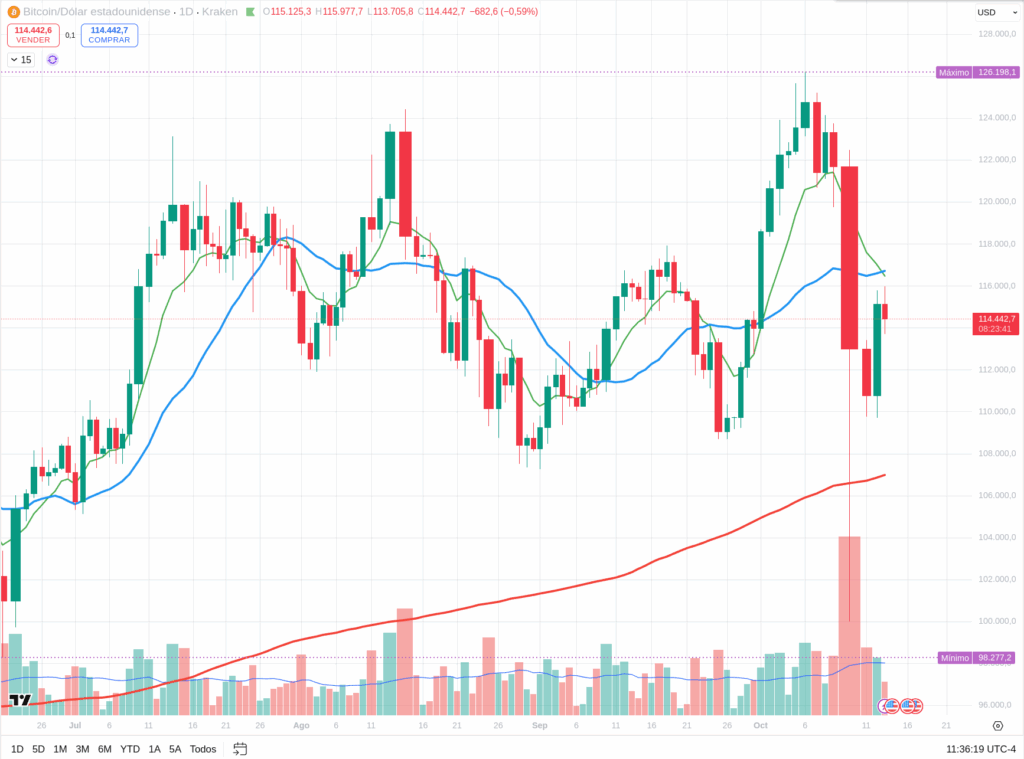
BTCUSDT (30 min)
- Immediate Resistance: ~$116,500 – $117,800
- Pivot / Mid-Control Zone: ~$113,500 – $115,500
- Critical Support: ~$110,000 – $112,500
Price Action & Signals: * A strong candle close above $116,500 with good volume and minimal upper wick would indicate buying strength. * Conversely, long upper wicks as price approaches resistance would signal seller dominance. * A firm close below $112,500 (especially on volume) could open the path towards the $110,000 support.
Indicators: * RSI (30m): Watch for approaches to 70 and subsequent rejections, signaling potential exhaustion. * MACD: A bullish crossover (MACD line above signal) reinforces upward momentum; a bearish cross is an alert. * Moving Averages (e.g., 50/200 MA): An MA50 crossing above MA200 suggests structural shift upwards; the inverse indicates increasing bearish pressure.
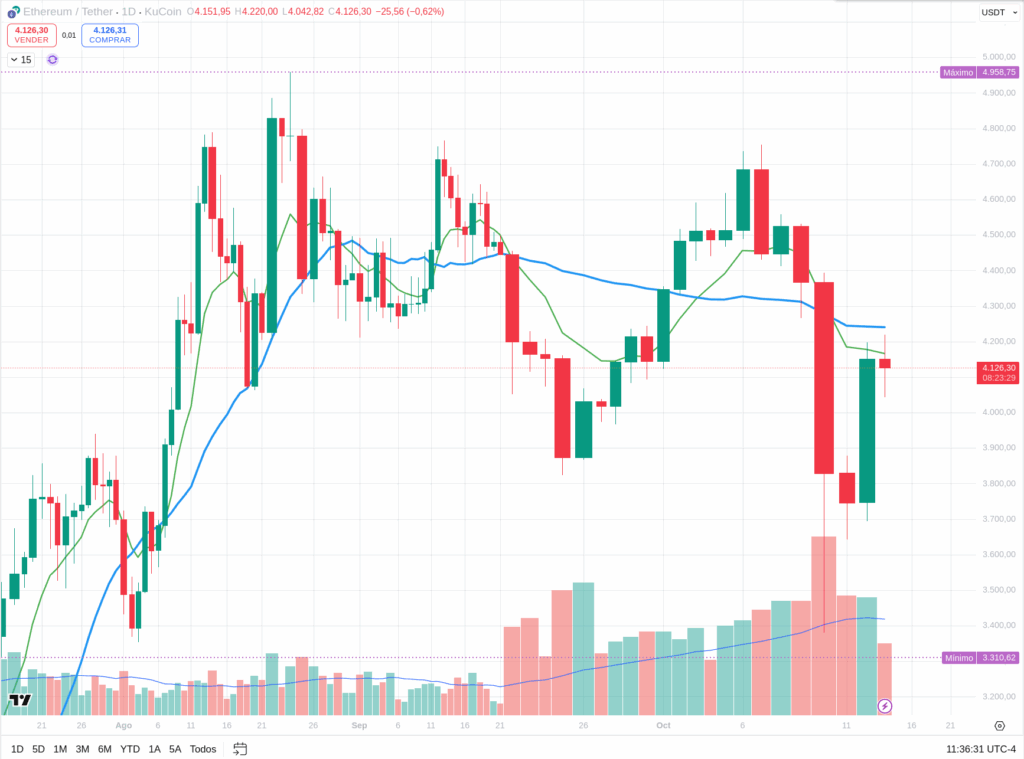
ETHUSDT (30 min)
- Resistance: ~$4,050 – $4,300
- Pivot / Control Zone: ~$3,700 – $3,900
- Key Support: ~$3,300 – $3,600
Price Action & Signals: * A strong candle close above $4,050 could signal buyers are stepping in. * Rejection with long upper wicks at resistance would indicate selling pressure. * A close below $3,600 with significant volume would point to further downside towards $3,300.
Indicators: * RSI: Monitor for reversals from the 70 level. * MACD: Bullish cross for upward momentum; bearish cross for selling pressure. * Moving Averages: MA50 crossing MA200 upwards reinforces bullish bias; the inverse warns of caution.
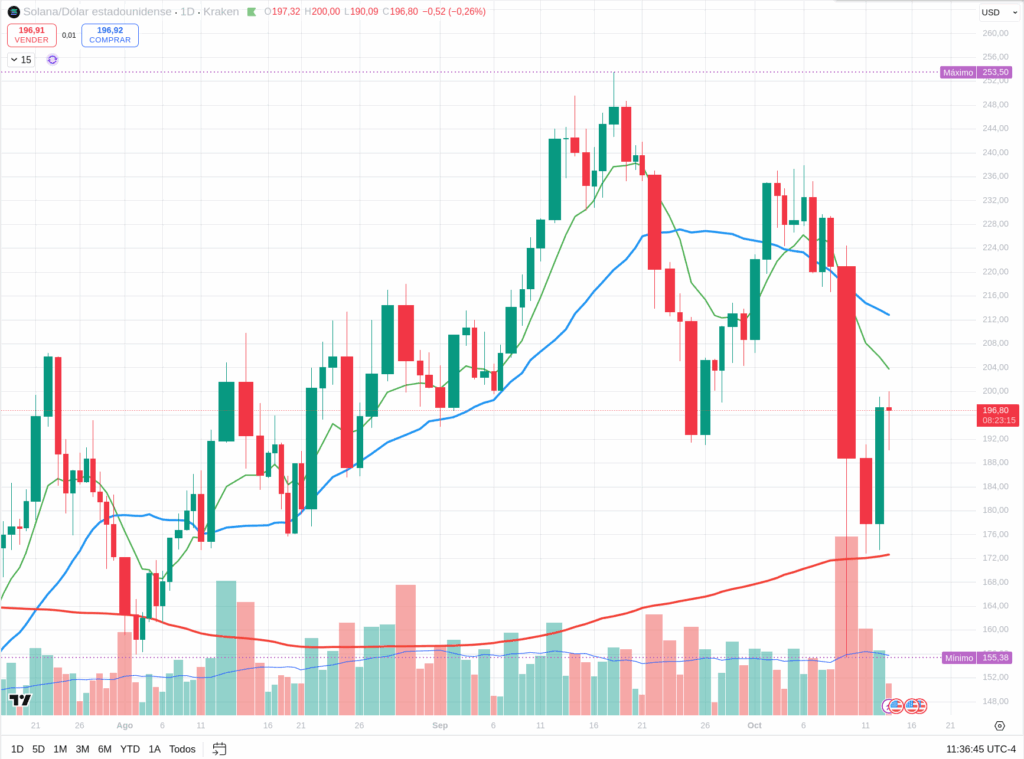
SOLUSDT (30 min)
- Resistance: ~$120 – $135
- Intermediate / Pivot Zone: ~$80 – $110
- Strong Support: ~$60 – $90
Price Action & Signals: * A convincing close above $120 with a clean body would suggest upward continuation. * Long upper wicks when testing $120 would imply sellers are defending that territory. * A decisive close below $90 with volume could trigger a fall towards $60-$80.
Indicators: * RSI: Approaching or exceeding 70 suggests exhaustion. * MACD: Bullish cross is positive; bearish cross is a warning. * Moving Averages: MA50 below MA200 suggests resistance; an upward cross could support the structure.
Final Thoughts & Strategy for Today
Today, given the profound impact of the tariff news and the market’s underlying fragility, my primary stance is extreme caution and observation. While a rebound might occur, its sustainability is highly questionable. The historical pattern of Fed rate cuts preceding further market weakness adds another layer to this cautious outlook.
Focus on confirmed price action; avoid anticipatory moves. RSI, MACD, and moving averages can help filter signals, but the raw price behavior around key support and resistance levels is paramount. Always, always use strict risk management.
Disclaimer: This content is for informational purposes only and represents personal observations and technical analysis. It does not constitute financial, investment, or trading advice. Please conduct your own research and consult a professional before making any financial decisions. For our full statement, please read our disclaimer here: https://tavoplus.com/disclaimer/
Related posts:
 Market Analysis (October 14, 2025): Crypto in the Red – What Caused the Massive Sell-Off?
 Market Analysis (October 8, 2025): The Market Holds its Breath for Fed Minutes as Ethereum Rejects a Key Level Again
 Market Analysis (October 9, 2025): Powell, Jobless Claims, and the Looming Question of a Crypto Correction