


If there’s one thing all of us who trade in financial markets have experienced, it’s the tendency to focus too much on the shape of the candlesticks—examining their bodies, wicks, and closing prices—while sometimes forgetting an essential factor: volume. This oversight becomes particularly evident when there are aggressive price movements, times when volume can reveal a great deal about the strength behind the price action.
In this article, I want to share a TradingView feature that, personally, has proven very useful in reminding me of volume’s importance: Volume Candle Charts.
“Volume precedes price.”
— Popular saying in the trading community
What Are Volume Candle Charts?
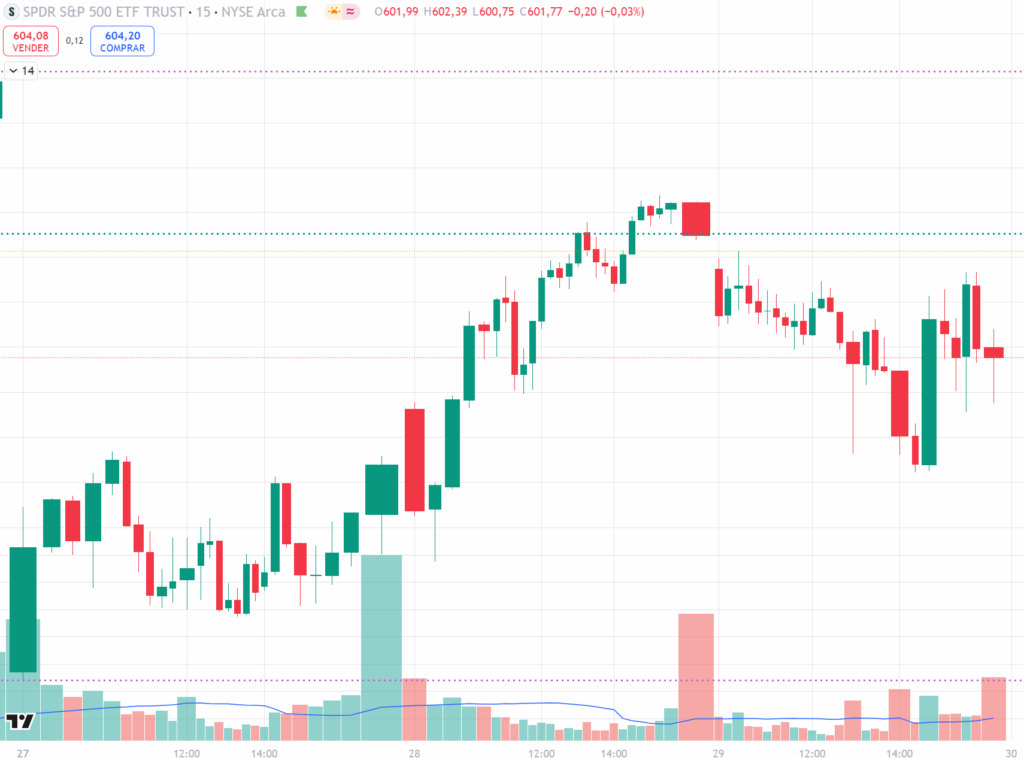
Unlike traditional candles, which form at fixed time intervals (for example, 5-minute, 15-minute, or 1-hour candles), volume candles are based on the number of trades executed in the market. In simple terms:
- Time-based candles: Each candle forms after a fixed period (e.g., every 5 minutes).
- Volume candles: Each candle forms once a predetermined volume of trades has been reached.
This means that if there’s a lot of activity and volume accumulates rapidly, volume candles will form more frequently, one after another. Conversely, during periods of low activity, it will take longer for a new candle to appear.
Why Are They So Useful to Me?
As I mentioned, sometimes I get so focused on the shape of the candle (whether it’s wide or narrow, has long wicks, etc.) that I forget to closely check the associated volume. However, volume candles integrate this factor visually, as the size of each bar or the formation of consecutive candles directly reflects how many trades took place during that interval.
- They Reveal the True Strength of Movements
- In a traditional candle chart, an upward movement might look very strong, but what if the volume is low? It’s likely less reliable.
- On a volume candle chart, a quickly advancing move also means that a high number of trades took place, indicating strong market interest.
- They Help Identify Areas of High Activity
- If you’re looking for important support and resistance levels, volume often confirms those key areas where buying/selling interest is concentrated.
- On a volume candle chart, spotting a zone with multiple candles formed by a high volume of trades can indicate a potential reversal or consolidation area.
- They Reduce “Noise” in Illiquid Markets
- During periods of low volume, time-based candles still form, even though there’s minimal trading activity, which can lead to misleading signals.
- With volume candles, if there’s no activity, the next candle takes longer to form, reducing noise from less relevant information.
Summary of the TradingView Feature
- Accessing the Configuration: In the upper-left corner of your TradingView chart, where you select the time interval (1m, 5m, 15m, etc.), click and you’ll see several options to change the chart type. Depending on your TradingView plan (free or paid), you may have access to different candle styles like “Heikin Ashi,” “Renko,” “Range,” and in some plans, “Volume Bars” or “Volume Candles.”
- Select “Volume Candles”: This changes the way candles are grouped, no longer by time but according to the volume threshold you set in the settings. For example, you could set 1,000 trades per candle or a fixed number of contracts/shares as the minimum unit.
- Adjust Parameters: You can define the lots, contracts, or volume unit you want for each candle. This varies depending on the market (stocks, futures, cryptocurrencies, etc.). Experimenting with different configurations will help you find what best suits your trading style.
Practical Examples of Use
- Spotting “Traps” in Sharp Movements
- Imagine you’re following a stock that suddenly makes a large upward candle on your 5-minute chart. You get excited and decide to buy. But on a volume candle chart, you might see that very few trades have actually been executed (low volume). That could indicate the move isn’t solid and might be a false breakout.
- With volume candles, you’d notice that this candle took a long time to form due to low volume, raising a red flag before entering a risky trade.
- Confirming Breakouts with High Volume
- Suppose an asset is consolidating in a range and suddenly breaks above resistance. If volume candles show that the bar formed quickly with a large number of trades, it reinforces the validity of the bullish move and reduces the chance of a false breakout.
- Sometimes, it’s easy to overlook the volume histogram at the bottom of a traditional chart. But if the chart itself is based on volume, that confirmation becomes much clearer.
- Trading Futures or Cryptocurrencies
- These instruments often have more dynamic volume fluctuations, so using volume candles can help pinpoint more precise scalping or day trading opportunities.
- Many traders combine volume candles with other order analysis tools (Order Flow) to spot liquidity zones or imbalances between supply and demand.
Conclusion
Next time you find yourself fixated solely on the shape of the candles and realize you’re overlooking volume, give TradingView’s Volume Candle Charts a try. This alternative will give you a different perspective on price action, especially during aggressive moves, where volume can make the difference between a successful trade and a false alarm.
Remember that, like any tool, volume candles are not a magic solution and should be complemented with other indicators and overall market analysis. Nevertheless, if you want to improve your interpretation of volume and gain a clearer view of how many trades are executed in each candle, this TradingView feature could become your new best friend.
Check Out TradingView’s Plans and Products
If you want to explore all the tools TradingView offers, I invite you to visit the following link:
TradingView Pricing
There you can learn about the different plans and their benefits to choose the one that best suits your trading style. Give it a try and take full advantage of these powerful features!
Related posts:
 Market Analysis (October 10, 2025): Friday Expirations, Consumer Sentiment, and the Shadow of a Correction
 Daily Crypto Analysis (October 7, 2025): Trading Volatility from the US Shutdown & EU Politics
 Market Analysis (October 8, 2025): The Market Holds its Breath for Fed Minutes as Ethereum Rejects a Key Level Again